NATURALGAS trade ideas

Natural Massive move coming!Natural Gas is tagging resistance.
Will we see a reversal lower off this level, we think so.
A potential stage 1 basing formation is nearing completion after this final shakeout.

Natural Gas - Elliott Wave CountNatural Gas - Elliott Wave Count
Natural Gas - the market seems to be forming ending diagonal on C of Wave 4 and we can see a decline to wave 5 soon.
Please note that this information is solely for educational purposes, and it is essential to exercise caution when trading
CAPITALCOM:NATURALGAS AMEX:UNG MCX:NATURALGAS1! PEPPERSTONE:NATGAS MOEX:NG1! FXOPEN:XNGUSD FOREXCOM:NATURALGASCFD

Naturalgas - Elliott Wave CountNaturalgas - Elliott Wave Count
Naturalgas - the market looks like in Triangle B and after the correction up to 2.34 or below level we can see a good pullback towards 2.78 range.
Please note that this information is solely for educational purposes, and it is essential to exercise caution when trading
MOEX:NG1! MCX:NATURALGAS1! CAPITALCOM:NATURALGAS FOREXCOM:NATURALGASCFD FOREXCOM:NATURALGASCFD CITYINDEX:NATURALGASCFD

Natural Gas: A Bearish Move Could Happen SoonNatural Gas: A Bearish Move Could Happen Soon
Price is forming a sort of "wedge pattern" before moving lower.
The pattern looks really good, but it needs to be developed more because it is not ready yet.
On the other hand, OPEC is speculating a lot about the price, making everything more difficult and we must be careful.
If the price reaches 2.4 again, it will increase the chances of a bigger, bearish wave.
You can find more details in the chart!
Thanks and good luck!

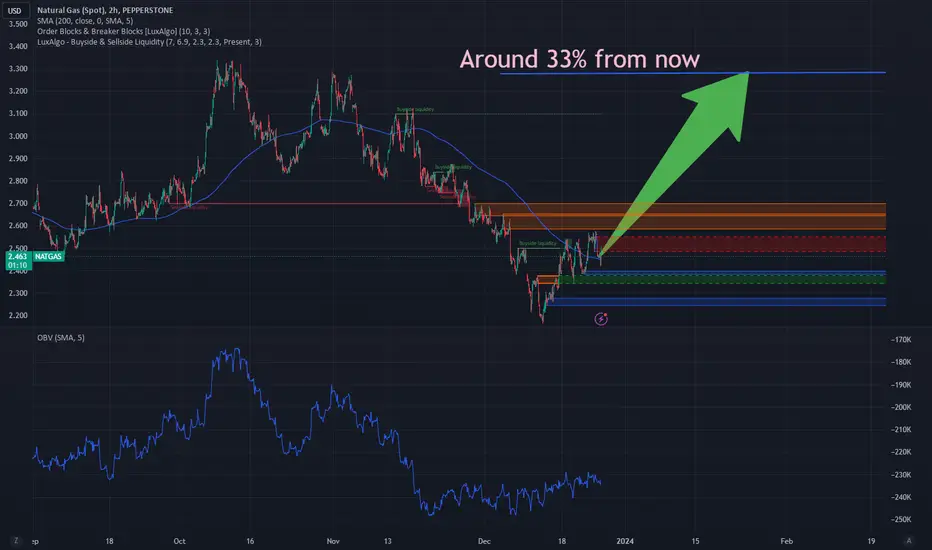
New Lows in NATGAS IncomingIn the past week, we introduced a long idea for NATGAS. Those who entered the position have been able to realize a gain of more than 6%.
While we initially anticipated prices well above 3,000, we have since abandoned that target and are now leaning towards the short side. The rationale behind this shift lies in the inability of the price to breach bearish order blocks and establish an upward trend.
On the fundamental front, the winter remains exceptionally mild, leading to a decline in NATGAS demand.
Considering seasonality as well, we anticipate that the price of NATGAS will trend towards the lows observed in April 2023.

naturalgas buy natural gas support and resistance on chart
trade plan - short natural gas target support area show on chart then buy on support area target resistance area show on chart

#NATGAS UpdateAn extremely busy chart with a simple notion that wave 1] is likely to be done and we are going through a correction that might prove to be flat considering the wave structure so far.


Natural Gas: Time to throw in the towell? Nat Gas Bulls cant seem to find any momentum continuation.
Lots of chop and slop is forming on the daily chart.
This choppy action could be shaping up for a new low after we get tag the next resistance.

NATGAS will Turn Bullish SoonThe weakness in the NATGAS (natural gas) price has surprised many analysts, including ourselves, to be honest.
Nevertheless, we anticipate that the natural gas price is currently undergoing an extended bottoming phase, and a near-term increase can be expected.
While targets beyond 4,000 may be overly ambitious, the range around 3,280 seems at least achievable in the medium term.
NATGAS Bullish Breakout! Buy!
Hello,Traders!
NATGAS is going up now
And we are seeing a
Bullish breakout of the
Key horizontal level
Of 2.486 and the breakout
Is confirmed so I think
That we will see a further
Move up after the market opens
Buy!
Like, comment and subscribe to help us grow!
Check out other forecasts below too!

NatGas UpdateThough my base case scenario is a contracting diagonal, I am also considering more extreme options to stay open-minded. Technically it would be the same.

Natgas UpdateWorking our way through the leading diagonal formation. If everything goes as planned, this will create a fantastic opportunity in early 2024.

Natural Gas slowly climbing! Natural Gas saw a larger drawdown from inventories this week.
Nat Gas had a higher weekly close!
Stage 2 basing formation is still in play!

A wave down before the start of the climb? bull marketHello!
I am a big fan of the Elliott wave principle, which I find very interesting and useful for market analysis. I have developed my analytical approach by combining this principle with my personal experience and considering various scenarios that could occur in the market.
While I would like to share my analysis with you, please note that I am not providing a buy or sell signal. My primary intention is to share my unbiased analysis so that you can utilize it as a guide to make an informed decision.
To build your confidence in my analysis, I always share my previous analysis from the same market so that you can compare and see the progress. All the details of my analysis are clearly labeled, which should make it easy for you to understand.
I hope that my analysis is useful to you in your business journey, and I wish you all the best.
I am looking forward to hearing from you. Lastly, I would like to mention that like-mindedness and support, comments, and likes are the most important pillars of progress, just like support points in the financial markets. They give me the energy to continue and share more ideas with you.
Sincerely

Natural GasNatural gas forming a butterfly pattrn and is heading towards its monthly lows. keep an eye

Important levels for the week with live chart linkCAPITALCOM:NATURALGAS
Hey Folks !
I have shared all the expected important levels for the week .
Club these levels with your existing trading strategy and experience.
Hope You have profitable week.

NATURAL GAS - NEW LOWS?NATURAL GAS - NEW LOWS?
Nat Gas, rejected 2x the resistance line and printed in top a falling star candle , next candle printetd a new low and for now im not looking to buy it , just wait to enter on a better price

NATGASNATGAS was trading in descending parallel channel. The price was reacting well the support and resistance of descending channel.
Currently the price has given the breakout of channel and now retesting the broken level where it is also forming a local support zone and seems like the price may go for another leg higher.
If the breakout sustain to upside the optimum target could be 2.8.
What you guys think of this idea?

Natural Gas in a Free Fall Natural Gas in a Free Fall
Natura Gas is moving in a well defined bearish trend.
During the previous week the price found the strength to breakout from a strong
daily/Weekly support zone located near $2.5
The support area now turned into resistance stopped the price rising more during yesterday afternoon.
Today the price is moving down again and probably it can test $2.1 price zone during the coming days or weeks.
Thank you and Good Luck!
