NATURALGAS trade ideas

NATGAS The Target Is DOWN! SELL!
My dear friends ,
NATGAS looks like it will make a good move, and here are the details:
The price is coiling around a solid key level - 2.372
Bias - Bearish
Technical Indicators: Supper Trend gives a precise Bearish signal, while Pivot Point HL predicts price changes and potential reversals in the market.
Target - 2.251
About Used Indicators:
For more efficient signals, super-trend is used in combination with other indicators like Pivot Points.
———————————
WISH YOU ALL LUCK

#NaturalGas Can Rise Up Very Quickly #NATGASTraders, Natural gas has created several bullish breakouts over the past weeks but failed to push higher. Now as we are reaching the end of the wedge pattern, a breakout is imminent. This can create a W pattern which in turn can push the prices higher.
Please support this analysis by liking and sharing. 👍🙂
Rules:
1. Never trade too much
2. Never trade without a confirmation
3. Never rely on signals, do your own analysis and research too
✅ If you found this idea useful, hit the like button, subscribe and share it in other trading forums.
✅ Follow me for future ideas, trade setups, and updates on this analysis
✅ Don't hesitate to share your ideas, comments, opinions, and questions.
Take care and trade well
-Vik
____________________________________________________
📌 DISCLAIMER
The content of this analysis is subject to change at any time without notice and is provided for the sole purpose of education only.
Not financial advice or signal. Please make your own independent investment decisions.
____________________________________________________

Natural Gas Clear Support & Resistance Guide | Falling Wedge- AMEX:UNG AMEX:BOIL PEPPERSTONE:NATGAS Natural Gas clear falling Wedge
- Daily uptrend confirmed without much follow through at the moment
- bulls would like us to hold prior pivot lows and bonce off next week

NATGAS Trading Opportunity! SELL!
My dear subscribers ,
This is my opinion on the NATGAS next move:
The instrument tests an important psychological level 2.348
Bias - Bearish
Technical Indicators: Both Super Trend & Pivot HL indicate a highly probable Bearish continuation.
Goal - 2.202
About Used Indicators:
The average true range ATR plays an important role in 'Supertrend' as the indicator uses ATR to calculate its value. The ATR indicator signals the degree of price volatility.
———————————
WISH YOU ALL LUCK

NATGAS: Short Signal Explained
NATGAS
- Classic bearish pattern
- Our team expects retracement
SUGGESTED TRADE:
Swing Trade
Sell NATGAS
Entry Point - 2.347
Stop Loss - 2.509
Take Profit - 2.104
Our Risk - 1%
❤️ Please, support our work with like & comment! ❤️

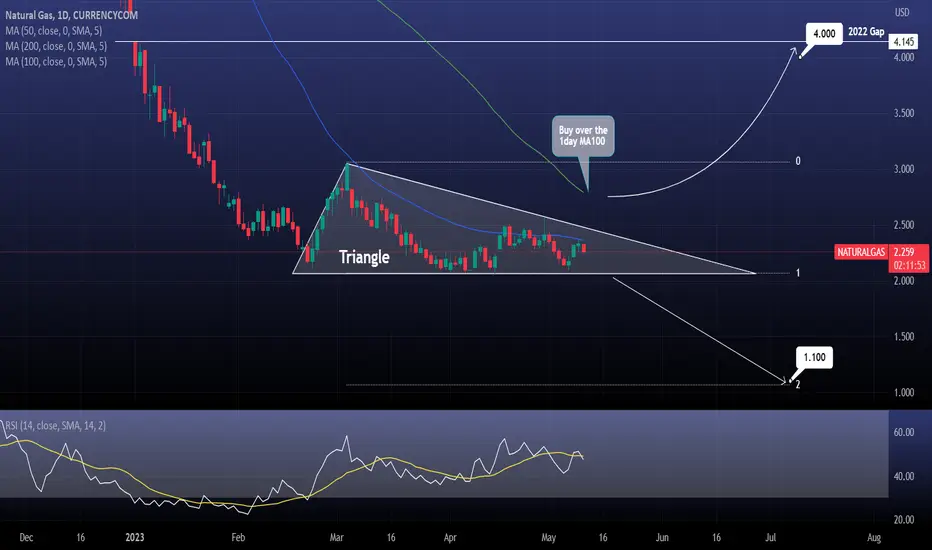
NATURAL GAS The Triangle's breakout will determine the trendNatural Gas is trading inside a Triangle, with the 1day MA50 as the Resistance.
The critical level is the 1day MA100. If the price breaks above it, target the gap from 2022 at 4.000.
If the price crosses under the Triangle's bottom, target Fibonacci 2.0 at 1.100.
Follow us, like the idea and leave a comment below!!

Picking NatGas BottomWhile I speculate that the bottom has been reached, the media speculates about another potential decline in NatGas prices.
Some expect a price crash to as low as €10: MET Group - www.bloomberg.com
Socionomics is a somewhat obscure idea, and those who have heard of it tend to dismiss it as pseudoscience (which, at this point, may be analogous to how the true science was perceived during the Inquisition era). Additionally, socionomics teaches us that the general public rarely notices market peaks and troughs. Rare occasions of excellent possibilities are governed by uncertainty and dread. Of course, there is no assurance that such a moment is coming up now. I just so happen to note that while headlines perfectly echo what I read in books about social behavior when market waves break, my analysis signals to a probable reversal.
You can find the longer term chart on my website.

NATGAS The Target Is UP! BUY!
My dear subscribers ,
This is my opinion on the NATGAS next move:
The asset is approaching an important pivot point 2.162
Bias - Bullish
Technical Indicators: Supper Trend generates a clear long signal while Pivot Point HL is currently determining the overall Bullish trend of the market.
Goal - 2.268
About Used Indicators:
By the very nature of the supertrend indicator, it offers firm support and resistance levels for traders to enter and exit trades. Additionally, it also provides signals for setting stop losses
———————————
WISH YOU ALL LUCK

NATGAS: Long Trade with Entry/SL/TP
NATGAS
- Classic bullish pattern
- Our team expects pullback
SUGGESTED TRADE:
Swing Trade
Buy NATGAS
Entry Level - 1.997
Stop Loss - 1.839
Take - 2.234
Our Risk - 1%
❤️ Please, support our work with like & comment! ❤️

Natural Gas Support and Resistance Guide | Price Outlook- AMEX:UNG AMEX:BOIL VANTAGE:NG Still trading within my falling wedge pattern is getting tight so likely breaking soon
- Bounced off of quadrupole support Friday
- couple of resistance level right above us may test the upper falling wedge resistance next week


NATURAL GAS: Hit the 2 month Support. Buying is favored.Natural Gas hit the S1 Zone today (2.100 - 2.060), which started forming on February 22nd. This support has held another 8 times and with the 1D time frame neutral technically (RSI = 45.392, MACD = -0.046, ADX = 18.986), we are making a buy call targeting the 0.382 (TP = 2.440). In addition, the 1D RSI is bouncing off the HL trendline.
In the event however that the 1D candle closes under 2.060, we will revert to selling and target the -0.236 Fibonacci level (TP = 1.830).
## If you like our free content follow our profile to get more daily ideas. ##
## Comments and likes are greatly appreciated. ##

NatGas UpdateVery good correlation over the last 2 weeks between oil and natural gas. Before they moved somewhat independently. Since I expect both of them to rally really hard, it is reassuring to see such correllation.

Natural Gas USD Fib based trend and resistance levels LONGHi all,
Presenting my new idea on Natural Gas which has had yesterday some impressing price action while indexes were falling., today is another important day and lets see what happens
As you can see the drop of price from 3rd -10th March measured by Fibs is 0.618, taking this as a correction in a rising trend we are given a price close to 4 USD (measured by Trend based Fib extension), The support levels and price gap just add to it, but please remember this is just an idea not a trading advise! See what is the loss you can hit if this goes in other direction and protect your capital
My long position is in 1:2 risk ratio
