NEAR Breakout Confirmed—But Is This Just a Bull Trap?Yello Paradisers! Did you see that breakout on #NEARUSDT? After weeks of consistent lower highs and a clearly defined descending resistance, price action has finally snapped that bearish structure and completed a textbook inverse Head and Shoulders formation on the 12H chart. This kind of pattern doesn’t appear often at key cycle points, and when it does—especially with confirmation—it becomes a high-probability signal of a trend reversal.
💎#NEARUSDT ,The neckline of the inverse H&S, sitting around the $2.17–$2.23 zone, has now been broken and crucially retested as support. This means the former resistance is now acting as a probable base for bulls, and if price remains above this area, the market is likely preparing for a strong probable impulsive move to the upside.
💎The structure shows clear bullish intent, and from a technical perspective, the first resistance comes in at $2.72. A clean break above that could open the door toward the major resistance zone between $2.97 and $3.05, which would complete the projected breakout target of the H&S pattern.
💎If bulls manage to maintain control above the $2.17–$2.23 support zone, we expect price to slowly build momentum toward $2.72, with increased volatility likely once that level is tested. Should that break occur with volume, the next leg may extend rapidly into the major resistance zone. However, if price fails to hold above this flipped support zone, we will be closely watching the $2.02–$1.89 area as the last major support before invalidation.
💎A daily candle closing below $1.798 would invalidate this entire bullish thesis and put the market back into a neutral-to-bearish range.
💎Adding more probability to this setup, NEAR is now trading above multi-timeframe EMA on higher time frame. This multi-timeframe EMA alignment supports bullish continuation, as momentum begins to shift in favor of buyers. However, continuation depends heavily on how price reacts at each resistance level—especially as we enter the mid-$2.70s.
💎The probable move from here is bullish, with the expectation that NEAR pushes toward the $2.72 level in the short term, followed by a potential rally to $2.97–$3.05 if momentum sustains. This scenario remains valid as long as price holds above $2.17, and especially above $2.02. Below that, the structure weakens. Below $1.798, the bullish bias becomes fully invalidated.
This is the only way you will make it far in your crypto trading journey. Stay sharp and patient, Paradisers. It’s not about chasing pumps—it’s about positioning smartly before the crowd.
MyCryptoParadise
iFeel the success🌴
NEARUSDT trade ideas

NEARUSDT 1D#NEAR is trading inside a descending channel on the daily chart and has recently bounced off a strong support zone.
It’s now on the verge of breaking above the channel resistance.
If a breakout occurs, the next targets are:
🎯 $2.453
🎯 $2.625
🎯 $2.796
🎯 $3.040
🎯 $3.351
⚠️ As always, use a tight stop-loss and follow proper risk management.

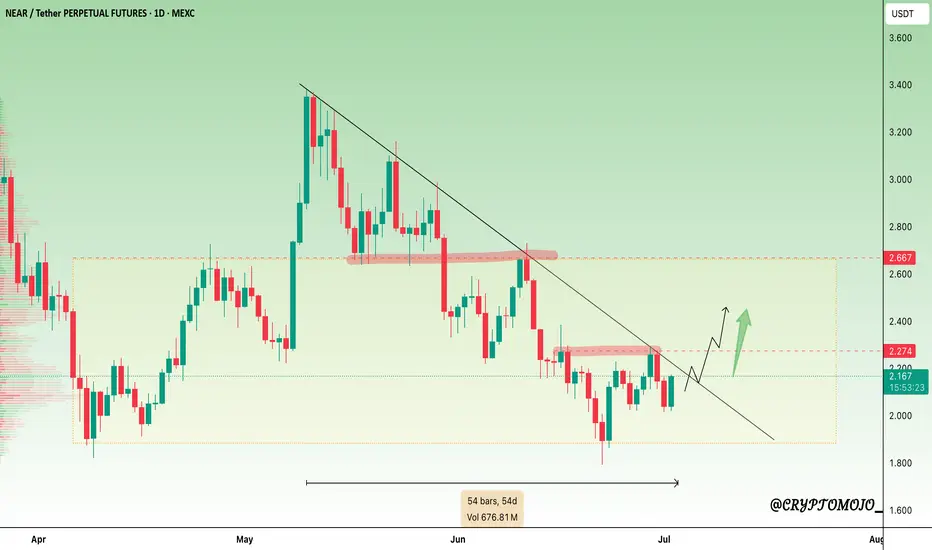
$NEAR Approaching Breakout from 54D Trendline!CBOE:NEAR
In the LTF, CBOE:NEAR is sitting at the 0.5 Fib retracement level.
Which is a pretty good level to buy.
We have a 54D long descending trendline resistance, which we need to break out of.
IMO, we will break this trendline soon, so keep an eye on it.
We have strong support at the $1.884 level, accumulate above this level.
DYOR, NFA
#NEARProtocol
$NEAR Disappointing so far...CBOE:NEAR is disappointing me as it continues towards the lows
Testing the .786 alt-coin golden pocket High Volume Node so should see a decent reaction from here as it appears a an ABC correction is complete after an Elliot wave motif wave.
Safe trading

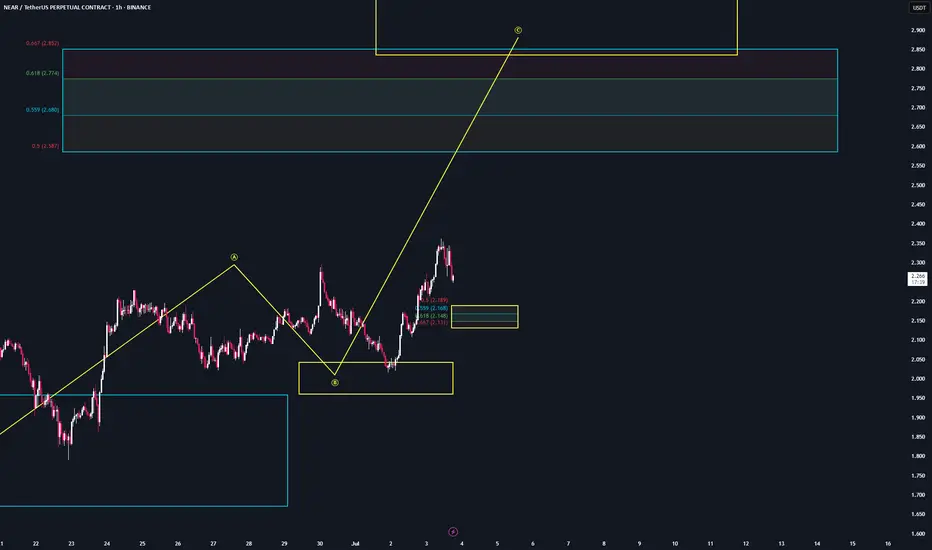
NEAR | Trade Setup📌 After the reaction from the bearish target zones (blue), we've now activated a bullish sequence (yellow) in $Near.
📊 Valid entries are currently forming during a potential B-C correction.
Trademanagement:
I'm placing long orders at each level.
Once the trade reaches a 2 R/R, I’ll move the stop-loss to break-even.
From a 3 R/R onward, I’ll start locking in profits.
Once I’ve locked in my first profits, I’ll share the next profit targets with you.
NEARUSDT Breakout Watch Descending Triangle Reversal in Progress🧠 Pattern and Structure Analysis
The NEAR/USDT pair is currently displaying a long-term Descending Triangle pattern that has been developing for over 6 months. While descending triangles are typically bearish continuation patterns, a breakout to the upside often signals a strong trend reversal.
Descending resistance trendline: Multiple touchpoints confirming the structure.
Horizontal support zone: Strong base formed between $1.79 – $2.21.
The current price action shows a potential breakout above the descending resistance, indicating a possible shift in trend.
🚀 Bullish Scenario
If the breakout is confirmed (especially with high volume and daily close above the trendline), NEAR could rally toward the following resistance levels:
1. Target 1: $2.693 – minor resistance
2. Target 2: $3.021 – key psychological and technical level
3. Target 3: $3.568 – previous support/resistance flip
4. Target 4: $4.635 – major resistance zone
5. Extended Targets: $6.028 and $8.062 – historical highs
📌 Breakout confirmation requires a daily close above $2.25 with increased volume.
🐻 Bearish Scenario
If the breakout fails and the price gets rejected at the trendline:
Price may revisit the strong support zone around $1.79.
A breakdown below this support would open the door to deeper downside levels, possibly below $1.70 or even toward $1.50.
The bearish outlook would be invalidated if the price sustains above $2.30 and forms a higher-high structure.
🔍 Strategic Summary
Pattern: Descending Triangle (Potential Reversal)
Breakout Level: ~$2.25
Key Support: $1.79 – $2.21
Recommendation: Watch for a confirmed breakout with strong volume. Use a trailing stop strategy to lock in profits as targets are reached.
#NEAR #NEARUSDT #CryptoBreakout #AltcoinSeason #DescendingTriangle #TechnicalAnalysis #CryptoTrading #BullishSetup #ReversalPattern #ChartPattern

NEARUSDT 1D AnalysisNEAR ~ 1D Analysis
#NEAR Buy back on retest of this support block with short term target of at least 15%+ from here.

YOLO Near USDT is a stellar buy here HUGE UPSIDELast cycle we saw a large correction to these levels before seeing a huge altcoin season. I believe we will see another run this cycle.
Near is a entry between $1.90 and 1.60.
Sell targets 8 20% sell
$12 20% sell
$16 20% sell
$20 20% sell
20% sell: Let it rideeeee to euphoria

Descending Channel Breakout Ahead for $NEARUSDTCBOE:NEAR is trading in a descending channel on the 6H chart.
After bouncing from $2.140 support, it’s showing signs of a short-term recovery, with a target of $2.50, 13.40%.
MACD crossover supports bullish momentum.
Holding support is key, or the downtrend continues.
DYRO, NFA

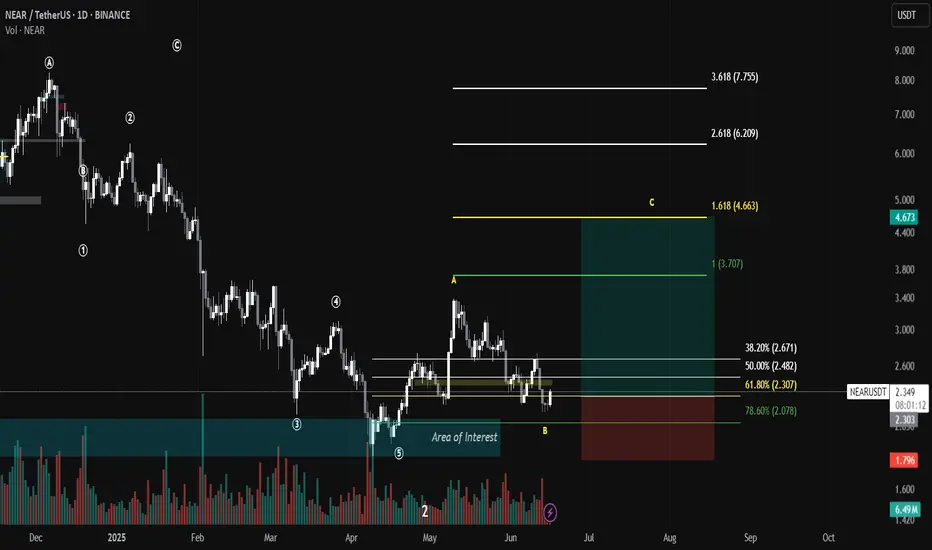
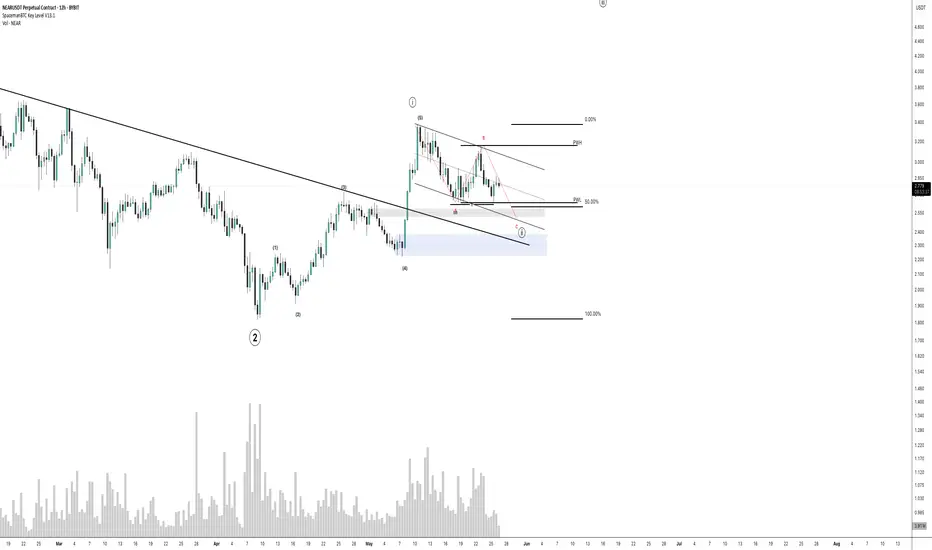
NEAR/USDT trade plan🧠 NEAR/USDT – Potential Wave C Setup (Elliott Wave + Fib Confluence)
📆 Timeframe: 1D | Exchange: BINANCE
🚀 Setup Overview:
We are likely entering a bullish Wave C based on the completion of an ABC corrective structure within a larger Elliott Wave pattern. The current price action has pulled back into a key "Area of Interest", aligning with multiple Fibonacci retracement levels, offering an attractive entry opportunity.
🎯 Entry Zone (Buy):
Between $2.30 – $2.35
This aligns with the 61.8% Fib retracement, a historically strong reversal level.
Also within the highlighted Area of Interest, marked by high volume and previous consolidation.
📉 Stop Loss (SL):
Set below the 78.6% retracement level: $2.07
A break below this level invalidates the ABC bullish setup.
📈 Target Zones for Wave C:
TP1: $3.70 (1.0 Fib Extension – Wave A equal to C)
TP2: $4.66 (1.618 Fib Extension – typical Wave C projection)
TP3 (Moonshot): $6.20 – $7.75 (2.618–3.618 extension for aggressive continuation)
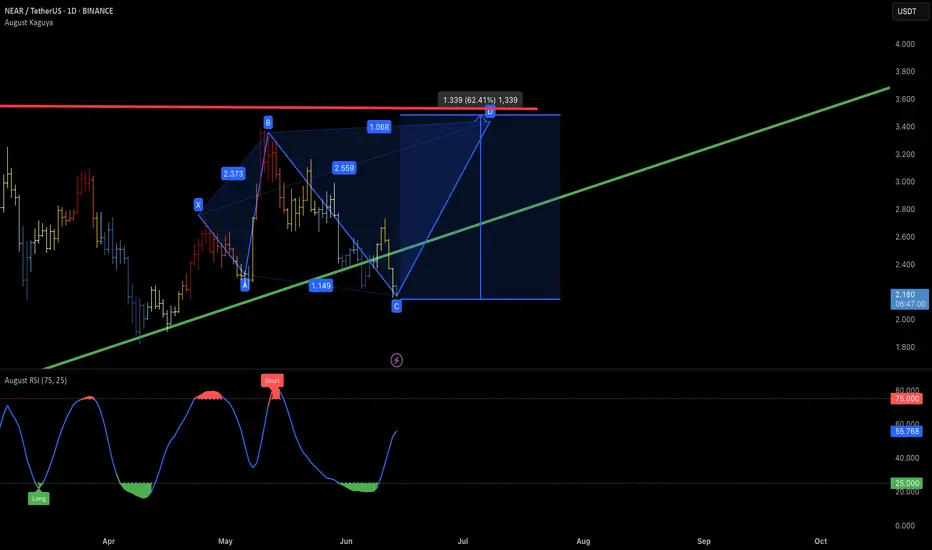
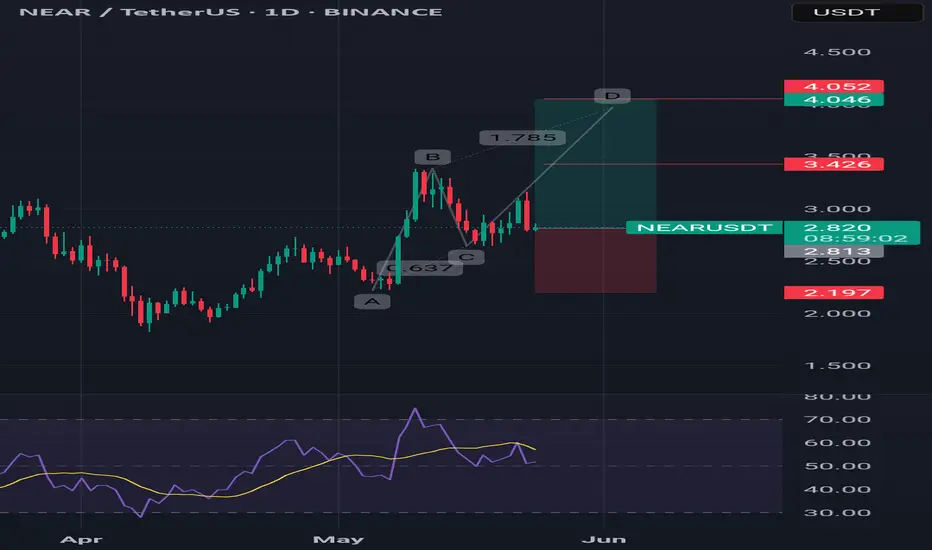
Long Setup on NEAR/USDTBullish harmonic pattern forming with confluence on the rising trendline and fib levels. Currently at point C, expecting a potential move toward point D.
📌 Entry: ~2.18 (current price, near C-zone)
🎯 Take Profits:
TP1: 2.55 (minor structure)
TP2: 2.85 (golden fib extension)
TP3: 3.20
TP4: 3.60 (major resistance / harmonic D point)
NEAR shortAs you can see on the chart NEAR has broken to the downside as multiple hourly candles have closed below previous swing lows.
I have identified an untapped OB which I will utilize for my zone to short.
Use max 5-8x leverage.
Good luck

Breakout Watch: NEAR Approaching Moment of Truth If you want, ICBOE:NEAR is currently testing the breakout zone but is still holding below the key trendline.
It’s a critical spot — if NEAR manages to break and close above this trendline, it could unlock further upside. For now, the trendline remains intact, so patience is needed here.
Watching closely to see if the breakout gets confirmed or if we see another rejection.
DYOR, NFA

TradeCityPro | NEAR: Key Support Battle in Layer 1 AI Protocol👋 Welcome to TradeCity Pro!
In this analysis, I’m going to review the NEAR coin for you — one of the prominent AI-focused and Layer 1 protocols that has gained significant attention in recent years.
🔍 This project’s coin, with the ticker NEAR, currently holds a market cap of $2.94 billion, ranking 34th on CoinMarketCap.
📅 Daily Timeframe
As you can see in the daily timeframe, there is a very strong support level at 2.239, which has been tested multiple times. The price has once again reached this zone.
✨ If this level breaks, the price could drop toward lower supports such as 1.694. Therefore, a break below 2.239 would be a valid trigger for a short position.
💫 The trendline drawn on the chart is also a significant level. If 2.239 is broken, price could potentially react to this trendline as well.
💥 If price holds this support and attempts a bullish move, we can open a long position upon breaking 2.653.
📈 The main long triggers, including potential spot buying, are at 3.355 and 3.548. If these levels are broken, NEAR could begin a strong uptrend toward targets at 4.726 and 7.998.
📊 Currently, market volume is ranging — buyers and sellers are evenly matched. We need to wait and see which side gains dominance to follow the momentum.
✔️ On the RSI oscillator, entering the Oversold zone would confirm a short setup, while breaking above the 50 RSI level would confirm a long setup.
📝 Final Thoughts
This analysis reflects our opinions and is not financial advice.
Share your thoughts in the comments, and don’t forget to share this analysis with your friends! ❤️

NEAR Protocol Can Hit $35 or $52 in 2025 (PP: 2,000%+)Back to what I was doing... NEAR Protocol (NEARUSDT) closed red three weeks and this week is the fourth week with the action being bearish, why am I bullish?
Four weeks of bearish action and there isn't much, well, bearish action. Total drop is less than 30%. If you look back to January, or say May 2022, four weeks red would be something completely different; market conditions are not the same.
The market now is not bearish nor crashing so we are only seeing a retrace, a retrace is a small correction that ends in a higher low. Wait, let me make a long story short, NEAR Protocol is set to grow.
The market bottom in October 2023 is much, much lower compared to the low hit April 2025, much lower. So we have a very, very strong higher low. This only reveals something we already know, NEAR is bullish and bullish means up. Prepare for growth. The 2025 targets can be seen on the chart.
» How likely is a new all-time high in 2025?
Probabilities are really, really high. NEAR Protocol has a very strong chart that points to a long-term higher high next. The ath being $20, it can easily go higher thanks to the strong higher low mentioned above.
» How long will it take for this new ath to be hit?
Can be anywhere between 4-8 months. I know it is a wide range but with thousands of altcoins, some will move first while others will take longer to reach their bull market top. But late 2025 is the main date and some altcoins will continue bullish through early 2026.
Yes, this pair can be approached with leverage.
Low leverage is better. Low risk is better. Spot is best.
Thanks a lot for your continued support.
Namaste.

NEARUSDT 1D AnalysisNEAR ~ 1D Analysis
#NEAR Buy again from here if you still have confidence in this coin with a short term target of at least 10%+ and a long term target of $8

NEAR to $45? The Signs Are All There…Just imagine traveling through time.
Many people look back with regret, wishing they had invested in cryptocurrencies before previous bullish cycles. We've all heard phrases like "If only I had bought Bitcoin at $100, I'd be a millionaire by now."
But the real question is: Will you have the courage to make the right decision when the moment comes?
You might think I'm crazy for presenting these targets today — and that's okay. But trust me, in a few months, you'll witness the phenomenal power of our analysis system. The market is fractal by nature; what happens on lower timeframes inevitably plays out on higher ones.
NEAR is one of the most promising blockchains, and all signals are aligning for a move toward $45.
The question is: Do you have the courage to take action now?

NEARUSDT UPDATE
Pattern: Descending Triangle Breakout
Current Price: \$2.937
Target Price: \$3.60
Target % Gain: 22.69%
Technical Analysis: NEAR has broken out of a descending triangle on the 8H chart. Price is closing above resistance with decent momentum, indicating a potential move toward \$3.60.
Time Frame: 8H

Near short continuation to HTF POINear is falling bellow the 200EMA on the 1H Time Frame and price is showing weakness trying to gain momentum to the upside.
Before we start the next big move up we need the price to go lower and grab some liquidity to have the necessary fuel to start the real move to the upside.

NEAR very bullish price actionNEAR is on its way to finish a wave 2 with a ABC pullback to Discount sweeping Previous Week Low.
If we close back bullish inside previous week range, we have a buy signal.
NEAR’s Pullback Zone Found — Is $4 Next?NEAR just pulled off a +50% rally from the 0.618 Fibonacci retracement at $2.224 — a strong show of force from the bulls. After that explosive move, price is now cooling off in a consolidation phase, preparing for the next leg higher.
🟢 Long Setup — Dip Before Lift?
The next high-probability long zone lies between:
$3.026 – $2.94
Possible but less likely of a deeper dip to $2.78 (0.5 Fib of the recent move)
Long entries can be laddered between $3.00 and $2.90 (even $2.80 if volatility kicks in).
Stop-Loss: Below the daily 21 EMA ($2.7344) and 21 SMA ($2.6739)
Target: $4.00
R:R: ~4:1 — clean and structured
This setup aligns with standard continuation behaviour after strong impulses — consolidation, retrace, and resume.
🔴 Short Setup (on Rejection at $4.00)
Entry: ~$4.00
Stop-Loss: Above $4.25
Target: Yearly open (~$3.65)
R:R: ~1.5:1 — not ideal, but valid on confirmation
🎯 Summary
NEAR is consolidating after a strong move — either ready to continue higher or retest deeper into Fib support
Long zone: $3.00–$2.90 (poss. $2.80)
Short zone: $4.00 (on rejection only)
Simple structure, clean risk, and nothing forced — exactly how it should be.
Sometimes, less is more. Let price show the next move. Stay ready. 📈
___________________________________
If you found this helpful, leave a like and comment below! Got requests for the next technical analysis? Let me know.

NEAR NEAR NEAR Hello friends
Considering the good growth we had, you can see that the price has corrected after reaching its ceiling.
Now, with the price correction, there is a good opportunity to buy in stages and with capital management and move towards the specified goals.
*Trade safely with us*
