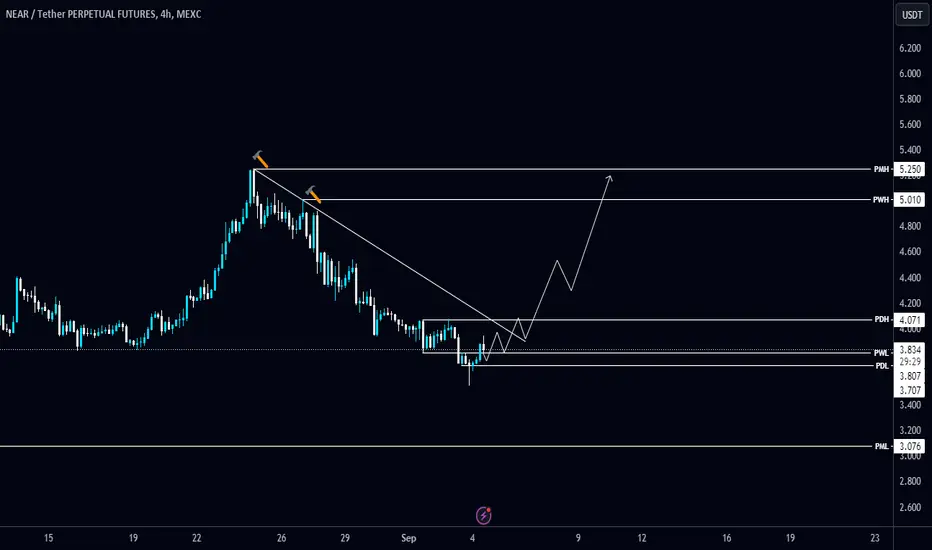
Near short term targets! Loading.. We will see a bounce for near soon. These are short term targets for increase continuation.
Scores are very suitable for such an increase.
Let's see!
NEARUSDT trade ideas

NEAR: Current Trends and InsightsNEAR Protocol is currently going through a period of volatility, with its price hovering around $3.89. Recent market trends show a mix of bearish sentiment and some cautious optimism among investors. Let’s break down the key indicators and levels influencing NEAR.
Current Sentiment: NEAR is mostly bearish, having dropped 3.5% over the last 24 hours. This follows a minor recovery earlier in the month, highlighting the ongoing struggle to maintain upward momentum.
Support and Resistance Levels
Key Support: $3.43 – This level has been tested and is crucial in preventing further declines. A break below this could lead to increased selling pressure.
Secondary Support: $3.60 – This level serves as an additional buffer in case of further price drops.
Key Resistance: $4.08 – A breakout above this level could signal a potential reversal in trend, opening the door for bullish momentum.
Secondary Resistance: $4.49 – If NEAR breaks through $4.08, this will be the next target for bullish movement.
Short-Term Predictions
Looking ahead, NEAR is likely to face challenges breaking through the $4.08 resistance. Analysts predict that if NEAR holds above the key support at $3.43, there could be opportunities for a rebound towards higher resistance levels in the coming weeks.
Potential Price Range for September 2024:
Minimum Price: $3.32
Average Price: $3.75
Maximum Price: $4.76
Market analysts are watching these levels closely as they may dictate NEAR’s short-term trajectory.
Recent News Impacting NEAR
Recent developments around partnerships and ecosystem growth in NEAR could help strengthen investor sentiment in the medium to long term. NEAR has been actively involved in collaborations aimed at improving DeFi capabilities and expanding user adoption, which may provide some resilience against the current bearish market.
Call to Action
For investors eyeing NEAR Protocol, now could be a strategic time to monitor the situation closely. With bearish sentiment dominating and key support levels being tested, it’s important to stay informed about market shifts and potential breakout signals.
While NEAR is facing short-term challenges, its long-term potential remains promising due to its ecosystem growth and ongoing developer interest. Stay vigilant and carefully consider your investment strategies!

NEAR ANALYSIS (bullish pattern)🌸#NEAR Analysis : Bullish Trend 🚀🚀
🚀As we can see that there is a formation of Flag & Pole Pattern in #NEAR in weekly time frame. Right now #NEAR is trading around it's crucial support zone and we can see a bounce back from its support zone 💪
🔖 Current Price: $3.965
⏳️ Target Price: $6.000
⁉️ What to do?
- We can trade according to the #NEAR chart and make some profits. Keep your eyes on chart price action, observe trading volume. Always observe market sentiments and update yourself everyday.🔰🔰
🏷Remember, the crypto market is dynamic in nature and changes rapidly, so always use stop loss and take proper knowledge before investments.
#NEAR #Cryptocurrency #Breakout #TechnicalAnalysis #DYOR

Bottom might be inIt says bottom might be in with “B” signal. If this is the bottom we can confirm, next direction is up only.

NEAR — Eyeing a Breakout?NEAR has developed a double bottom pattern, a classic reversal setup starting to emerge across several altcoins. This structure often signals a potential trend shift, but the key lies in how NEAR handles the $4.15 to $4.35 resistance range.
Currently, NEAR is attempting to push through this essential zone, which has acted as both support and resistance in the past. A clean break above $4.35 would significantly strengthen the bullish case and could trigger a move toward $5, and potentially beyond.
Key Technical Levels:
$4.15–$4.35: This is the immediate barrier. The potential for upside remains capped until NEAR closes decisively above this range.
$5 target: Should NEAR clear the $4.35 level, the next logical stop is $5, a fundamental psychological level and a technical pivot from earlier this summer.
EMA200: At around $4.9, the EMA200 poses another challenge. The last time NEAR approached this moving average, it was rejected. Clearing this level will be critical for a sustained move higher.
The Bullish Case:
The double bottom pattern and improving price action hint at a potential breakout. If the overall crypto market turns bullish, NEAR could benefit from this momentum and push beyond $5, making it an attractive play. The chart is showing some constructive signs, but patience is required.
The Caution:
Until NEAR cleanly breaks through $4.35, the setup remains fragile. Entering before this area is cleared carries risk, especially with the EMA200 looming overhead as a critical resistance. It’s a waiting game for now—the signal will come once we see confirmation above $4.35.

$NEAR - H4 Chart - Intraday Setup Idea- Set alert for price to return to H4 POB around $4.08. It is also within the FVG.
- When alert triggers, look for MSB on the 15m chart.

One more leg down?there is still a chance for one more leg down to $2.5 area before it starts its upwards journey to its ATH.

#nearusdt getting ready..Let's see what will happen ! You can see previous bull bear signals from the chart.

NEAR#near
#nearusdt
Falling wedge channel
Wait till the break out and confirmation.
Good chance to accumulate in part ( spot)
Future - 10x liv
Long

$NEAR/USDT IS READY FOR A MONUMENTAL MOVE.Big alts. season is about to kickoff as Near/usdt gearing up to take a lead. We are presently testing the rectangular middle range support which is very crucial to hold for a quick bull run.

#NEAR/USDT rejecting from Diagonal Trendline in 1-Hour TF!#NEAR/USDT rejecting from Diagonal Trendline in 1-Hour TF!
AMEX:NEAR needs to clear the Trendline to turn bullish. Wait for BO/retest to long it. The local resistance level is PDH $4.071.
NEAR/USDTThis week we will have CPI news and most likely we will have more fall on crypto, so you can buy 1 step in the fall and hold for long term.

Trade Setup: NEAR Long Position (Range Support Test)Market Context: NEAR is testing the bottom of the range level of support, providing a favorable opportunity for a long trade.
Trade Setup:
Entry: Long spot position at $3.50 - $3.80 support level.
Take Profit:
First target: $4.30
Second target: $5.00 - $5.40
Final target: $6.00 - $6.50
Stop Loss: Just below $3.40
📊 This setup aims to leverage the support level for potential upside, with clearly defined profit targets and a tight stop loss to manage risk effectively. #NEAR #CryptoTrading #SupportLevel

NEAR#near
#nearusdt
1h time frame
Near is framing falling wedge, falling wedge usually break out towards the upside, just wait a break out and confirmation,
And falling wedge target -$5.25
#dyor
#nfa

NEAR#near
#nearusdt
1h time frame
Near is framing falling wedge, falling wedge usually break out towards the upside, just wait a break out and confirmation,
And falling wedge target -$5.25
#dyor
#nfa

NEARUSDT🔍 NEAR/USDT Analysis: Key Dates for Strategic Moves 📉
The NEAR/USDT chart highlights important upcoming dates where price movements may present trading opportunities:
• August 21, 2024, August 28, 2024 - Red Lines: These dates mark potential local peaks. Traders should consider these as moments to take profits or reduce exposure, as the price might face resistance or a downturn.
• August 23, 2024, September 1, 2024 - Green Lines: These dates indicate potential local lows, offering favorable conditions for accumulating NEAR or entering long positions.
By aligning your strategy with these key dates, you can better position yourself to capture gains and manage risk effectively in the NEAR market.
Note: The exact timing of these phases can vary by +/- a few hours. All times are based on UTC-7 (Los Angeles).

NEAR🔍 NEAR/USDT Analysis: 4-Hour Timeframe 📉
The NEAR/USDT chart on a 4-hour timeframe highlights significant upcoming times where price movements may present trading opportunities. These signals should be analyzed in conjunction with higher timeframes for a comprehensive market view.
• September 1, 2024, 9:00 AM, September 9, 2024, 9:00 AM - Green Lines: These times indicate potential local lows, offering favorable conditions for accumulating NEAR or entering long positions.
• September 16, 2024, 9:00 AM - Green Line: This time marks another potential local low, which may present an opportunity to buy.
When working with this 4-hour timeframe, remember to evaluate these movements within the context of the broader market trend, considering higher timeframes for a more global perspective.
Note: The exact timing of these phases can vary by +/- a few hours. All times are based on UTC-7 (Los Angeles).

NEAR short3day frame: downwoard trendline deirected toward collision with the 200 MA.
SHORT with target 3- 3.10 USD, then bounce.

NEAR Attracts Buyers Above 4.4NEAR Attracts Buyers Above 4.4
Near completed a bullish triangle pattern and already broke out also from the top of the pattern thus attracting more buyers.
The trade is entering in another phase after this bullish move by showing a more solid bullish picture.
If the price holds above 4.4 we can likely see the bullish momentum rising further up to our targets.
You may find more details in the chart!
Thank you and Good Luck!
❤️PS: Please support with a like or comment if you find this analysis useful for your trading day❤️

NEARUSDT. Buying opportunitiesHello traders and investors!
If you are looking to buy, I suggest considering NEAR. I believe there is a good potential for growth of 20-40%.
Daily Time Frame
On the daily time frame, the price has formed a sideways range that started in March. The upper boundary is at 8.52, and the lower boundary is at 4.279.
The price has touched the lower boundary twice. The second interaction, which occurred on August 5, was marked by impressive volume, which was absorbed by the buyer on August 13, pushing the price back into the range. This candle was pivotal (the largest volume, marked with “KC” on the chart) in the seller’s impulse, which forms vector 4-5 of the range. By absorbing this candle, the buyer established a buying zone (green rectangle on the chart) from which buyer's vector 5-6 started, with a potential target of 6.89.
The buyer faces a significant obstacle beginning at the 50% level of the last seller's impulse, at 5.798. At this same level, a seller’s zone (red rectangle on the chart) has formed, and the level 5.798 is the start of the last sub-impulse of the seller's last impulse.
Interestingly, the last sub-impulse of the buyer started at the 4.000 level (low of the sub-impulse at 4.000, high of the sub-impulse at 6.489), and on August 5, liquidity was taken below the 4.000 level.
4-Hour Time Frame
There is a long trend. The starting level of the buyer's last impulse is at 4.738. A seller's zone formed at the end of this impulse. Currently, the buyer is testing this zone. If the price returns to 4.738 and the buyer defends this level, there may be buying opportunities, as the seller resumed action from the seller’s zone at the end of the impulse (meaning the zone has been tested), and the seller could not defeat the buyer at the beginning level of the last impulse.
Buying Strategy
It makes sense to look for buys from the daily candle of August 23, which showed a surge in volume. The targets are 6.000 and 6.489.
Good luck with your trading and investments!

Bullish continuation: ABCChart description
- Potential finished WXY (wave B)
- Daily close above 50SMA(d), 3d close would signify bullish case
- RSI trend crossing (micro)
- Long setup with initial target w3 target
Price is moving impulsively, and w3 target at 1.618fib is still 30% higher then current price lvls.

NEARAscending Triangle
An ascending triangle is a breakout pattern that forms when the price breaches the upper horizontal trendline with rising volume. It is a bullish formation.
I would like to wait for break at $4.45
Long -$4.45
Sl -$3.75
TP-5.67

NEAR LONG TRADENEAR/USDT is looking long here.
Reason:- 1- MSS ( Market structure shift)
2- SSL Created.
3- FVG.
4- Order Block.
