NEAR - Hold on tightFantastic narratives around NEAR and fantastic chart. Is it an AI coin - i guess so but I don't even know what that means. Anyway, it has high development activity (one of the few). In the chart - we've ABC'ed and found support at the .236 (beautiful). We continue up hard during the first alt season but be prepared for a daunting correction before we make a final run - that if equities don't collapse. This coin is one of the few that has the potential to reach the 4.23 EXT of its marketcap.
NEARUSDT trade ideas

Near Protocol NEAR Intraday Trade SetupThe chart highlights breakout/rejection points, criteria, and targets to execute on the trade opportunity.

📈 NEAR: Capitalizing on Bullish Momentum🚀🔍Let's delve into today's analysis. Weekly candlesticks closed yesterday, revealing compelling entry points for some altcoins. Even Bitcoin displayed a robust candle, indicative of buyer strength. Given the current market dynamics, it seems logical to consider adding Bitcoin to our portfolios. However, after thorough research, I've identified an altcoin that presents a relative uptrend to Bitcoin. In a market poised for upward movement, this altcoin is likely to outperform Bitcoin, offering greater potential returns.
💎The coin in question is Near Protocol (NEAR), a native coin of the Near Protocol blockchain. It boasts a robust project, making it a worthy addition to your bull market portfolio. Our previous entry point, as per our strategy, was a breakout above $3.823. While I didn't provide the detailed analysis then, it's crucial to stay vigilant for such entry opportunities. Since our entry, NEAR has delivered nearly 100% profit, doubling our investment.
⚡️A popular strategy suggests selling half of your position when your investment doubles, allowing you to secure profits while letting the remainder ride the market's ups and downs. However, I have a different approach. I firmly believe in holding onto my investments until Bitcoin surpasses $40,000, as I anticipate a bullish future for altcoins. These coins have the potential to multiply several times over, significantly increasing your capital.
📈Now, let's delve into the technical analysis and understand why NEAR should be part of your portfolio. On the weekly timeframe, after bottoming at $1 in October 2023, NEAR began its upward trajectory, witnessing a remarkable 600% growth. Yet, its potential extends far beyond these figures. Following a crucial resistance breakout, we're witnessing an influx of buying volume. Last week's candlestick, consolidating above the SMA7, signals strength and potential for further upside.
✅Moreover, the RSI indicator has exited the overbought territory, presenting an opportunity for a third bullish wave. With these insights and prudent capital management, now may be an opportune moment to enter a long position. For risk management, consider placing your stop-loss below $5, or even $4 for added security. As for targets, $17 presents a conservative estimate for Target 1, with potential for further gains upon its breach.

NEAR USDT LONG PHEMEXNear has more utility than BTC. Currently top
20 Cryptos with a megaCap of 5.3 Billion. it will rise quickly. 4 targets listed
The astronomical chance that YOU exist are nearly nonexistent. Use that and live your best life! You'll love yourself for it

Near protocol NEAR price finished its correction?Today, we'll talk about the prospects for #NEARUSDT price movement
The last time we wrote a medium-term forecast for Near's price movement was 4 months ago.
The forecast was $3.70 ↘️$2.50 ️↗️ $10, and the current high was $9
Come on, admit it, who started selling AMEX:NEAR before the target ?)
When the correction began, we made an estimate of where it would be interesting to buy #Nearusd - $3.85 - $4.50.
The price has already squeezed there, and to be honest, we would not want to see NEAR below $4.
And if you look at the current chart of NEARUSDT on the 12-hour timeframe, you will see 5-6 "shadows" from the bottom, which means that the coin is being bought back.
Our medium-term targets for the Near protocol token price are $10 - $13 - $15.50 - and ATH = $20
_____________________
Did you like our analysis? Leave a comment, like, and follow to get more

Near look good to Long Clear Uptrend: The chart shows a clear uptrend, indicating upward price movement.
Parallel Channel: Price action is within a parallel channel, suggesting a structured trend.
Phases Identified: We can observe phases of Accumulation, Manipulation, and Distribution.
Distribution Phase: Near is currently nearing the retest of the distribution phase.
Entry Opportunity: Consider entering long positions around $5.8 during this phase.
Targets: Potential targets for this trade are $7.6, $12.49, and $21.750.
Invalidation: If the price breaks below the channel downside and closes a daily candle below it, the setup is invalidated.
FOMC Meeting: Keep an eye on today's FOMC meeting as it could influence market direction.

NEAR PriceThe Near Protocol (NEAR) has overtaken the round mark of $7 and has displayed a falling wedge pattern breakout on the charts.

NEARUSDT.P | LongIt is about to enter a range that can be evaluated through near spot. Our orders may come with BTC's possible Monday low determination.

Near AgainNear Again ,,,Any breakout for triangle & trend drawn above, We'll see another explosion of the coin...lets watch

🔍📈 NEAR Trading Strategy 📉📊Market Observation:
Monitoring BTC's proximity to the $60,000 resistance, which could influence altcoin movements. NEAR is currently at a support level, presenting a potential long opportunity.
Trade Setup:
Ladder into a long spot trade within the current trading range or $5.75 - $6.20 support area. Alternatively, wait for BTC to break through $60,000 before entering.
Take Profit: Target next resistance areas at $7.40 - $7.75 or $8.45 - $9.00.
Stop Loss: Just below $5.58 to manage risk.
Risk Management:
Use a stop loss below $5.58 to limit potential losses.
📈💡 Trade Strategy Rationale:
Anticipate a bullish move in NEAR from the support level, with profit targets aligned with resistance levels.
🔄📊 Stay updated on BTC's movements for trade entry adjustments! #NEARTrading #CryptoAnalysis 🌐🚀

#NEAR looks promising for the long term!NEAR is forming this huge bull flag.
For the long term, this seems like a solid choice. Its strong tokenomics and competent team make it a promising asset. The chart indicates the potential for significant growth in the next few weeks.
It may drop to $4.3 support, which is a very strong support, but there is one more support at $5.
So consider adding more if it drops below $5 to $4.3.
Remember to do your own research.
NFA

near long signal 1 hour time framenear at strong support looking good what do u think write in comments ?

NEAR 43024Will we see a return to the top of the range. A possible twenty percent play. this looks like a good punt for me
I will take this along with LTC

#NEAR/USDT Token is considered a promising asset due to its str#NEAR/USDT
Token is considered a promising asset due to its strong tokenomics and competent team🤔
In the short term, a trading price above $10 seems probable📈

#NEAR/USDT Short term Target!#NEAR for the long term seems like a solid choice.
Its strong tokenomics and competent team make it a promising asset.
The chart indicates the potential for significant growth in the next few weeks.
Don't be shocked to see it reach triple-digit prices when the real alt season hits!
In the short term, a trading price above $10 seems probable.
Consider adding more if it drops below $5.
Remember to Do Your Own Research.
NFA

NEAR ANALYSIS🔮 #NEAR Analysis 💰💰
📊#NEAR is making perfect and huge rounding bottom pattern in weekly time frame, also we can see that there is a good retest in #NEAR indicating a potential bullish move. If #NEAR breakout the pattern with high volume then we will get a bullish move📈
🔖 Current Price: $7.029
⏳ Target Price: $11.811
⁉️ What to do?
- We have marked crucial levels in the chart . We can trade according to the chart and make some profits. 🚀💸
#NEAR #Cryptocurrency #Pump #DYOR

Bullish SituationIn the weekly timeframe, NEAR has successfully broken through its key resistance level. This breakout, which is visible on the chart, indicates the potential for price growth. If Near can sustainably maintain its price above this resistance level, we anticipate an increase in its price.

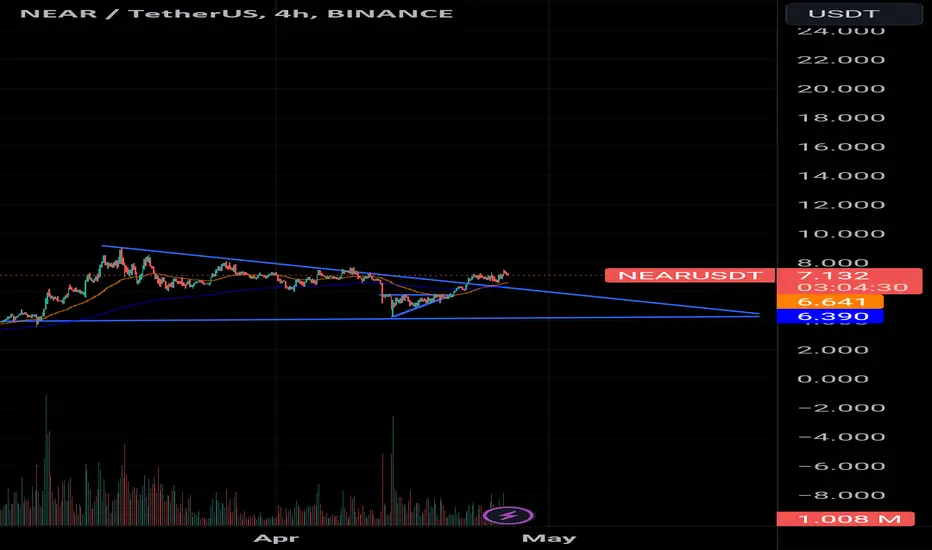
#near/usdt is experiencing a breakout👀 The potential target fo#near/usdt is experiencing a breakout👀
The potential target for price, in case of a successful breakout, is at $9🎯
Potential Short Scenario for NEAR/USDT: Key Level BreakdNEAR/USDT has been experiencing a significant uptrend over the past few weeks, but recent price action suggests a potential reversal might be on the horizon. A key support level has emerged, and a breakdown below this level could signal further downside momentum.
A breakdown below this level could unleash additional downside potential, offering short trading opportunities for savvy traders. However, always remember to conduct thorough analysis and exercise proper risk management to navigate the volatile cryptocurrency markets effectively.

NEAR/USDT, Continuation Pattern shows a potential upwardSupport is identified at the 6.6 USDT price level. The breakout from the significant chart pattern is currently manifesting as a bullish flag pattern. The anticipated target price stands at 9.4 USDT.

Market Review 25.04Review after correction BINANCE:ETHUSDT.P BINANCE:DOGEUSDT.P BINANCE:NEARUSDT.P BINANCE:DOTUSDT.P BINANCE:SOLUSDT.P

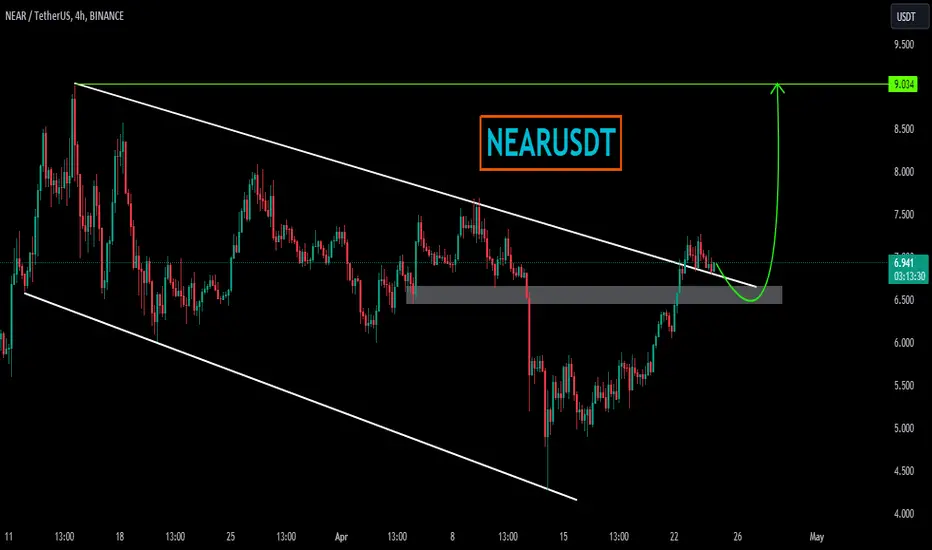
NEARUSDTNEARUSDT was trading under the declining trendline. The price was reacting well the support and resistance of trendline
Currently the price has given the breakout from declining trendline with confluence to strong bullish divergence and now seems like the bulls are getting ready for some strong upside movement.
If the bulls sustain to upside the optimum target could be 9.5
What you guys think of this idea?
Bullish continuationDesciption chart setup:
- Possible short formed W (RSI trendbreak confirmed 4h)
- Descending triangle formation for a possible wave 4 (Retracement fib target reached 0.382)
- Target box laid out in chart
