NEARUSDT- Bearish outlookThe crypto pair NEAR is making LH and LL forming a bearish trend. The crypto have given fakeout along the way but look like the bull are not ready to charge. The pair made a bearish divergence along with a bearish engulfing, showing confluence near its recent High. Trade setup is a sell opportunity with Entry price, SL and TP mentioned.
NEARUSDT trade ideas

Finally Near Preparing For Bullish Wave Towards 10$crypto market is in uptrend and its easier to find entries with trend
seems like near is getting ready for another breakout consolidating in bullish pennant and expecting upside breakout incase breakout expecting solid bullish wave towards 10$

Nearusdt AnlysisNear usdt is in up trend as per the rsi momentum indicator and also the fib retacement show the uptrend

$NEAR #NearProtocol Trading IdeaNEAR/USD (NearProtocol) formed another bull flag/pennant on the daily timeframe for another potential leg up. Full send after a breakout but if we break below this red neckline we can also retest $4.645.

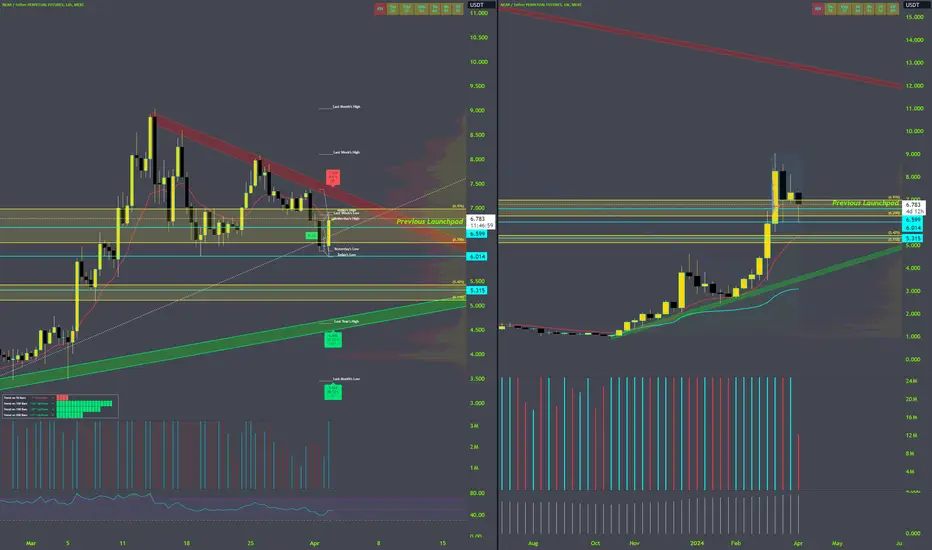
Fueling on the LaunchpadLong story short - last time we were fiddling around with this level, NEAR rocketed to $20.
Now we are forming more support here and around this level....possibly fueling for a nice move higher. We have a few levels of support right below current price action, but my next trend line support is 33% away. I dont really wanna see the 12h structure break downward. 33% is alot, and I personally tend to miss the shorts more often than the longs. Because thats a great short.
[NEARUSDT] - on the verge of breakoutthe falling wedge pattern in consolidation in daily chart.
in the green circle that i highlighte u can see the price action in fibbonaci levels.
always breakout with huge green candle... that happen twice in (0.5 ,0.618).
now we waiting for a breakout the upper side of falling wedge...that will make our next target is 10$
Thank you, and for more ideas, hit "Like" and "Follow"!🎯

Near a clean setupNear has shifted its bearish structure into bullish so I am looking for long oppertunity in marked OB+FVG+SSL area. A very clean chart.

NEAR/USDT LONG SETUP Hello traders. I am here for analysis near/usdt chart for better understanding
So after downward movement now strocture shifting to up ward
I think 7$ level we can enter for buy if confirmed
Yellow zone is the most secure zone for buy position with small stoploss
It located in .78 fib level


NEARUSDT LONG OUTLOOKHello Traders, this is outlook that i think might be work. All Entry, Stop Loss, and Take Profit its already showed up. All trade it is on yourself. DYOR.

The chart says it all, no need to explain!!
NearUSDT is in an uptrend within a triangle channel and on the weekly chart
Trade now or wait for a pullback at $6.9

NEAR can ascend further!Hi
BINANCE:NEARUSDT
Today, I want to analyze NEAR for you in a weekly time frame so that we can have a mid-term view of NEAR regarding the technical analysis. (Please ✌️respectfully✌️share if you have a different opinion from me or other analysts).
NEAR formed a rounding bottom on weekly timeframe🤔
Up we go if we do breakout
✅ Due to the Ascending structure of the chart...
- High potential areas are clear in the chart.
- AB=CD
- Rounding Bottom
Stay awesome my friends.
_ _ _ _ _ _ _ _ _ _ _ _ _ _ _ _ _ _ _ _ _ _ _ _ _ _ _ _ _ _ _ _ _
✅Thank you, and for more ideas, hit ❤️Like❤️ and 🌟Follow🌟!
⚠️Things can change...
The markets are always changing and even with all these signals, the market changes tend to be strong and fast!!

$NEAR Bullish OutlookNEAR is on the verge of a breakout on both the 1d and 4h chart.
The reason I’m bullish is as you can see on the chart, it has been testing the upper trend line of the Symmetrical Triangle formation repeatedly without shooting back down to support immediately which is a good sign of bullish buying.
I would wait for a breakout confirmation on the 4hr (1-3 candle closes above resistance line) and enter a long position no more than 5x (personal preference and risk tolerance)
DYOR/NFA

NEAR (Y24.P1.Video1). RAnging but bullishHi Traders,
My thought for #NEAR #crypto are bullish and I see this as an entry for potential another attempt to break the trending resistance.
We plan and we implement.
All the best,
S.SAri

Near/Usdt Plan Near/USDT has recently experienced a breakout from a triangle pattern on the 4-hour time frame. This breakout has already been confirmed, and the retest of the breakout level seems to be nearly completed. As a result, there is an expectation of a 20-40% bullish move in the short term for Near/USDT.
Please note that the information provided is for educational purposes only and should not be considered as financial advice. It is essential to conduct your research (DYOR) before making any investment decisions.

NEARUSDT Forming triangle in 4h timeframe, ready for downNEAR in 4h frame is forming a triangle shape, ready for a dump to 5$-5.5$
And setup a good base to buy for 1day hold frame

NEARUSDT Major Trend BreakoutNEARUSDT (1W Chart) Technical analysis
NEARUSDT (1W Chart) Currently trading at $1.556
Buy level: Above $1.58
Stop loss: Below $1.2
TP1: $2
TP2: $2.5
TP3: $3.7
TP4: $6
Max Leverage 2x/Spot Market
Always keep Stop loss
Follow Our Tradingview Account for More Technical Analysis Updates, | Like, Share and Comment Your thoughts

NEAR Protocol weeklyPrice broke above $8.00 resistance, but it got overbought (RSI ~ 80) and was rejected. Hence, near-term, we’re likely to see it pause here on some profit taking. We would be buyers on pullbacks to $6.00 support. Stop Loss (SL) at $5.10, just below prior swing low. (set a price alert).
Trend: Uptrend across all time horizons (Short- Medium- and Long-Term).
Momentum is Bullish but inflecting. MACD Line is above MACD Signal Line and RSI is above 55 but momentum may have peaked since MACD Histogram bars are declining, which suggests that momentum is weakening.
Support and Resistance: Nearest Support Zone is $6.00 (previous resistance), then $4.60. The nearest Resistance Zone is $8.00, then $10.00. For short term and $17.00 for long Term

Near isn't lookking to good Maybe its just me but NEAR is looking scary 😨
It has an untapped liq and its looking to head that way

$NEAR Macro 3Mhere's a 3M chart on AMEX:NEAR
the instruction are simple and clear on the chart
the March candle close will be very interesting to determine the next direction
closing above a FVG could potentially lead to a leg up
closing below mid FVG or below FVG would potentially lead to a pullback,
retesting lower FVG
educational purpose only
nfa

NEAR 1HThere's potential for an upward swing, but it's all hanging on BTC's current trajectory. The support level is clear. The only downside is the lack of strength in most last 1H candles, 30min are more bullish for scalp. We'll need to wait it out and see how Bitcoin plays out before making any moves.
On the 1-hour chart, BTC is holding support as indicated by clusters, but sellers are also capitalizing on this level to offload some holdings.

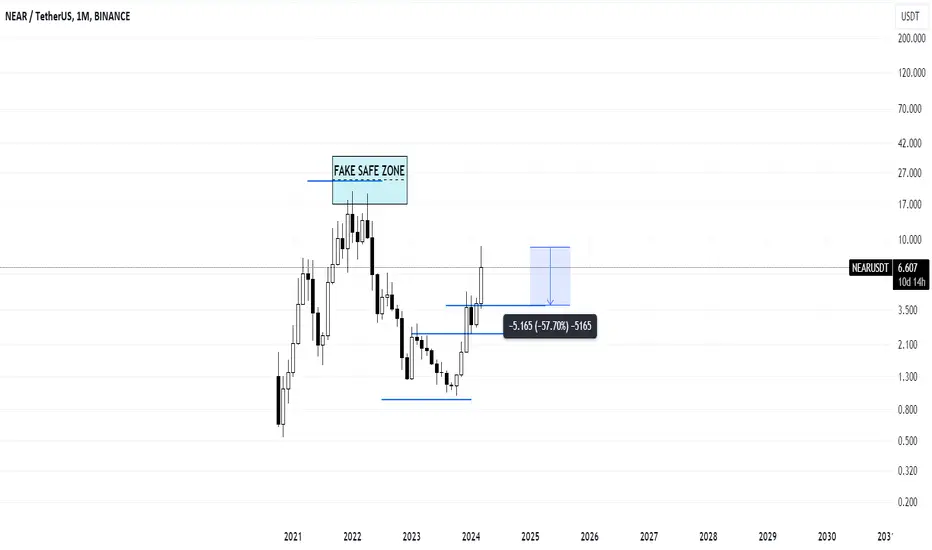
NEAR ideaa fake safe zone is what I note as, a place where most traders will place their Stop Loss, because the zone gives them a FEELING of SAFETY
but that isn't actually SAFE
usually, previous ATH are considered fake safe zone
meaning, price will eventually rally so hard to a new ATH and take all the SL above previous ATH
also, note that in crypto, especially altcoins, price can dump 58% and still have the bullish market structure intact, then rally hard to new ATH
so that's why it's important to DCA
spot is always better than futures imo
educational purpose only
nfa
Is NEAR chasing a new ATH?Hello everyone!
The #NEAR cryptocurrency has already brought us good profits last year. I suggest you consider entering a trade at this point.
At the $6 level, we have a strong support zone that is clearly visible on the chart.
You can open a position from the current price levels, or you can also place another buy order around $6 just to be safe.
The main target is $12.48. You can also set sell orders at all the important Fibonacci levels:
$10.85
$9.43
$7.92
I believe that the asset may continue to move above these levels.
This is not financial advice, and all trading is done at your own risk!
Follow me to receive more trading ideas.
