NEAR coin is preparing to riseThe Moving Average100 level will be breached, causing the currency to rise towards higher areas
NEARUSDT trade ideas

$NEAR - huge potentialWith MYX:AURORA skyrocket since yesterday, it is good idea to keep close eyes on $NEAR. Technically, bouncing from EMA50, TF H4 will be a good entry point

NEAR Q3 OverviewExecutive Summary
NEAR Protocol stands as a Layer-1 (L1) smart contract blockchain that couples a state-of-the-art sharded architecture with an emphasis on offering a user experience reminiscent of Web 2 platforms. While maintaining the security and decentralization integral to blockchains, NEAR aims to surpass the capabilities of prior chains, such as Ethereum, in terms of usability, efficiency, and scalability. Recognizing and aiming to overcome Ethereum's limitations, NEAR incorporates sharding. This key distinction allows the blockchain to significantly enhance its throughput, accommodating a more substantial transaction volume by dividing the blockchain into smaller, concurrent shards.
A pivotal differentiator for the NEAR Protocol, sharding was introduced in November 2021 as Nightshade. This technique allows validators to process only transactions specific to their assigned shards, enabling potentially infinite scalability. For end users and investors, Nightshade ensures quicker transaction speeds at reduced fees. Diverging from traditional sharding methods that split the blockchain into multiple states, NEAR's design maintains the blockchain as a singularly sharded entity. Additionally, a synchronized state mechanism ensures that a change in one block's state prompts adjustments in other shards correspondingly.
In March 2023, NEAR unveiled the Blockchain Operating System (BOS), a groundbreaking open-source platform that allows developers to craft applications across various blockchain environments using well-known programming languages. Moreover, it provides crypto users with an experience reminiscent of Web 2. Designed to be inclusive, BOS appeals to Web3 veterans and those new to the decentralized web. By ensuring easy onboarding, robust security, and seamless cross-chain interactions, BOS is setting a new paradigm for Web 3 application development.
The NEAR Foundation, with the inception of the NEAR Digital Collective (NDC) and a pivot to community DAOs, is pioneering a transition to a more democratized and decentralized framework compared to the conventional Board-based system. Launched in Q3 2022, the NDC represents a concerted effort to decentralize decision-making within the NEAR network, emphasizing transparency through defined treasury management and embracing decentralized governance with on-chain voting. Furthermore, the NDC aspires to advance validator decentralization and stimulate the development of the core protocol and infrastructure.
Looking forward into 2024, the Near protocol will introduce several pivotal milestones, including the next step in Nightshade sharding, meta transactions, zero-balance accounts, a Global Storage proposal, and more.
Introduction to Near
NEAR Protocol is a Layer-1 (L1) smart contract blockchain with a bleeding-edge sharded design and an emphasis on an intuitive Web 2-like customer experience, all while preserving the security and decentralization users expect with a blockchain. Established in 2018, it sets out to achieve improved usability, efficiency, and scalability over preceding chains like Ethereum. Founded by Illia Polosukhin and Alexander Skidanov and spearheaded by the Near Collective, the NEAR Protocol was envisioned to serve as a community-driven cloud computing PoS blockchain and a decentralized hub tailored explicitly for hosting innovative decentralized applications.
The central motivation behind NEAR's technology is to prevent network congestion and furnish a conducive environment for developers, thereby promoting on-chain protocol development. Early on, NEAR identified certain operational challenges in Ethereum, particularly related to network congestion and high/volatile gas fees, that it looked to solve. To do so, Near turned towards sharding.
A key differentiator for NEAR, sharding, in essence, provides the ability for a blockchain to increase its throughput and handle a larger number of transactions by partitioning the blockchain into smaller parallel shards. In its pursuits, Near introduced an original approach to sharding in November 2021 known as Nightshade, initially unveiled as Simple Nightshade. The underlying principle of Nightshade is that validators are not burdened with the task of processing every incoming transaction. Instead, they only handle transactions that are within specific shards. By doing so, Nightshade paves the way for theoretically limitless scalability. But what does this mean for the end user or investor? Primarily, this approach, which is entirely abstracted from the end-user experience, allows for reduced transaction fees while ensuring rapid transaction speeds.
Additionally, Near recently launched a new initiative in early 2023 known as the Blockchain Operating System (BOS). This development represents a significant shift in how we perceive blockchain platforms. The BOS is designed to integrate seamlessly with various blockchain systems while facilitating decentralization and discoverability, which have historically been impossible to achieve together.
Essentially, the BOS is grounded in blockchain technology but broadens its application by acting as a universal layer, making it adaptable to different blockchain frameworks. One of its primary features is the provision of a decentralized platform for front-end development. This platform aims to simplify the creation of blockchain applications by emphasizing clarity and flexibility.
One of the core advantages of BOS is its potential to decentralize user interactions, improve security protocols, and enhance the modularity of components. Additionally, it prioritizes compatibility across diverse blockchains, presenting developers with a more intuitive and straightforward development environment.
NEAR Technologies
Blockchain Operating System (BOS)
In March 2023, the NEAR protocol introduced the Blockchain Operating System (BOS), an open-source platform empowering developers with the flexibility to build across diverse blockchain environments using familiar programming languages and equipping crypto users with a familiar Web 2 UX. The BOS is designed to be inclusive and democratize the open, catering not only to seasoned web3 enthusiasts but also to the broader audience who might be newer to the decentralized web. A significant breakthrough in the system is eliminating the immediate need for a new user to own any cryptocurrency, substantially reducing the friction of user onboarding.
Additionally, the BOS interface streamlines access and navigation, making it more user-friendly for both developers and the general populace. Moreover, it enables users to search through a portal to diverse communities and applications, all the while prioritizing data privacy. Further, the BOS's user-centric design, coupled with its focus on accessibility, does not just simplify the onboarding experience but also bolsters the discovery of new applications.
Remarkably, the BOS functions both as a development platform and a social network. It’s an environment where users can both deploy and unearth new applications. In delivering straightforward onboarding procedures, unmatched security, and fluid interactions across all chains, the BOS is reshaping the framework for constructing Web 3 applications.
Source
BOS Under the Hood
The Blockchain Operating System (BOS) by NEAR seeks to redefine the landscape of Web3 applications through its unique architecture based on three pivotal elements: components, blockchains, and gateways. Here, we will delve into the significance of each element and examine how they collectively shape the BOS framework.
Components: The Building Blocks of BOS
Components exist at the decentralized application (dApp) layer and can be equated with notable platforms such as Lido, Uniswap, Compound, and others. They stand out for their on-chain storage, high degree of transparency, and their ability for developers to fork these applications, harnessing their functionalities and composability to craft comprehensive web applications. Storing the entirety of a component's code on-chain not only ensures auditability but also bolsters security. With the code readily available for scrutiny in blockchain explorers, users can operate these applications locally, enjoying resilience against potential censorship and a streamlined user experience. This ability to natively audit and locally run the applications represents a paradigm shift in the user-app relationship.
Blockchains: The Underlying Infrastructure
The versatility of components and the BOS becomes apparent in their ability to interact with numerous blockchains and smart contracts instead of just one chain. Currently, BOS offers compatibility with all EVM chains, such as Ethereum, Polygon, Arbitrum, and Optimism, as well as, the native NEAR platform. As EVM chains dominate the TVL in the DeFi space, the BOS’ ability to work across nearly all enables users to tap into nearly all the liquidity and top dApps in the crypto economy. NEAR's capability to efficiently and cost-effectively store HTML/CSS/JS makes it the preferred choice for hosting app source codes.
Gateways: Bridging the Gap to Decentralization
Gateways, the third pillar of the BOS, facilitate the delivery of decentralized front-ends to a broader audience. Each gateway is underpinned by a bespoke virtual machine (VM) equipped to load and run frontends for protocols, be they Ethereum-based, Layer 2 solutions, or alt-L1 platforms like NEAR. All code pertaining to these frontends finds its home on the NEAR blockchain. The gateways are diverse, ranging from wallets and portfolio tools to distinct applications like SWEAT. They cater to tasks as rudimentary as adding swap functionality or as intricate as erecting decentralized app stores. Integrating this expansive functionality requires just the addition of a JavaScript library, followed by a selection of desired app front-ends. Prominent gateway exemplars include near.org, bos.gg, near.social, Cantopia, and nearpad.dev.
The decentralization of composable front ends enabled by the BOS is unique to Near, filling a conspicuous and much-needed void in the crypto arena. Instead of relying on centralized data servers, these front ends are blockchain-stored, promoting both composability and resistance to potential censorship. Historical instances, such as Uniswap's token delisting and the sanctions imposed on Tornado Cash, underscore the vulnerabilities of front ends. BOS’s decentralized approach allows developers the flexibility to fork these front ends and build in the truly OSINT environment that the cryptocurrency movement was built upon.
BOS Advantages
The BOS aims to integrate decentralization with discoverability and developer flexibility. Central to the BOS framework is its array of Web3 development tools that are crafted with the intent of pushing Web3 mainstream. From the onset, the system is designed to enhance user onboarding, improve cross-chain development and app discoverability, and create a seamless UX for Web3 users.
This last point on abstracting away different blockchains for a seamless Web3 experience has benefits beyond simply improving UX. It can potentially also reduce the liquidity fragmentation and tribalism associated with a fragmented crypto economy built around disparate, siloed blockchains. The BOS proposes a solution to this by striving for a consistent user experience across multiple blockchains and allowing developers globally to access and implement various Web3 components. With users and developers now (potentially) unable to discern which blockchain they are using, there is no longer a need to promote one over the other.
None of this is possible without the composability offered by the BOS. The system aims to be chain and language-agnostic, allowing developers to reuse and adjust different components while utilizing the language of their choice. The BOS supports a variety of languages for smart contract development, including JavaScript, Rust, AssemblyScript, and Solidity. Complementing this are their collaborations with established cloud providers, namely Google, Seracle, and Alibaba Cloud, to make transitioning from Web2 to Web3 as comfortable as possible.
In addition, NEAR has initiated the NEAR Dev Hub, a platform envisioned as a resource hub for developers. Preliminary outputs from this initiative include sponsored hackathons and the establishment of community groups.
Thresholded Proof of Stake
The NEAR Protocol operates on a distinct consensus mechanism known as "Thresholded Proof of Stake" (TPoS). Similar to other PoS implementations, TPoS still uses validators, who must stake NEAR tokens to participate, to validate transactions and ensure the integrity/security of the network. However, within the TPoS environment, validators can assume one of four pivotal roles:
Chunk Producers: Their primary responsibility is to authenticate transactions on individual shards, subsequently crafting a chunk, often referred to as a "shard block", from their designated shard.
Block Producers: These validators gather chunks from their chunk-producing counterparts associated with discrete shards. Their function culminates in the production of a block, which is then added to the primary chain.
Hidden Validators: Operating under a veil of confidentiality, these validators authenticate random shards — shards whose identity remains a secret to them and is undisclosed to the public. This veil serves a dual purpose. Firstly, it considerably complicates the task for any malevolent entities attempting to compromise them. Secondly, it robustly augments the chain's overall security measures.
Fishermen: Actively overseeing certain chain segments, these validators act as the guardians against fraudulent activities. They constantly monitor, ready to flag any nefarious activities. Interestingly, their operational requirements are modest — a minimal stake. However, this role, though critical, doesn't confer any rewards.
Central to TPoS is its innovative auction system employed to select validators. This methodology, in essence, discourages the practice of pooling. When validators amass resources, they not only amplify their individual rewards but also consolidate control over the chain. Such centralization runs counter to the foundational principles of blockchain, which emphasize distributed control. The TPoS design confronts this challenge head-on by placing natural barriers against pooling.
Additionally, TPoS tackles the issue of consensus forking — a scenario in which multiple validators simultaneously contribute blocks to the chain. Such events can elongate the time required for transaction finality. By minimizing the possibility of these forking instances, TPoS ensures swifter transaction finality.
Validator Requirements
Validators bear the critical responsibility of validating and executing transactions across the entirety of NEAR's sharded blockchain. Additionally, they monitor their peers (other validators), ensuring no invalid blocks are produced or alternate chains are formed. Validators found compromising network stability undergo "slashing," where part or all of their staked assets are confiscated. To compensate for their services and inherent risks, NEAR validators receive a inflationary protocol rewards, amounting to 4.5% of the total supply annually.
Given the complexity of the validator role, there are stringent hardware requirements (e.g. costs) for anyone looking to run one. To effectively run a validator, a robust system configuration, consisting of an 8-Core CPU, 16GB of RAM, and 1 TB SSD storage, is necessary. Current estimates indicate that the monthly expenditure for hosting a block-producing validator node stands at $330+.
This excerpt just scratches the surface, for the full report, click here .


NEAR/USDT - NEAR Protocol: Resistance_Breakout◳◱ A Resistance Breakout has been identified on the AMEX:NEAR / CRYPTOCAP:USDT chart. The price has broken above a key resistance level, indicating a potential bullish trend. The next resistance key levels are located at 1.094 | 1.131 | 1.23, and the major support zones can be found at 0.995 | 0.933 | 0.834. Consider entering at the current price zone of 1.151 and targeting higher levels.
◰◲ General info :
▣ Name: NEAR Protocol
▣ Rank: 44
▣ Exchanges: Binance, Kucoin, Bybit, Huobipro, Gateio, Mexc
▣ Category/Sector: Infrastructure - Smart Contract Platforms
▣ Overview: NEAR is a decentralized development platform that uses a Proof-of-Stake (PoS) consensus mechanism and will eventually feature a sharded architecture to scale transaction throughput. Its block generation scheme is called Doomslug and its proposed sharding design is dubbed Nightshade. These technologies will work together to scale the network and minimize congestion. NEAR has also been designed to be developer and user-friendly as it features a few key innovations to accelerate the application development and user-onboarding processes. The NEAR blockchain was created and developed by the NEAR Foundation. Its mainnet went live in April 2020, and network validators voted to unlock token transfers in October 2020. NEAR's bridge to Ethereum (called the Rainbow Bridge) launched in March 2021.
◰◲ Technical Metrics :
▣ Mrkt Price: 1.151 ₮
▣ 24HVol: 22,726,465.007 ₮
▣ 24H Chng: 9.933%
▣ 7-Days Chng: 14.38%
▣ 1-Month Chng: 5.37%
▣ 3-Months Chng: -15.50%
◲◰ Pivot Points - Levels :
◥ Resistance: 1.094 | 1.131 | 1.23
◢ Support: 0.995 | 0.933 | 0.834
◱◳ Indicators recommendation :
▣ Oscillators: SELL
▣ Moving Averages: STRONG_BUY
◰◲ Technical Indicators Summary : BUY
◲◰ Sharpe Ratios :
▣ Last 30D: -1.76
▣ Last 90D: -2.58
▣ Last 1-Y: -0.90
▣ Last 3-Y: 0.73
◲◰ Volatility :
▣ Last 30D: 0.36
▣ Last 90D: 0.39
▣ Last 1-Y: 0.81
▣ Last 3-Y: 1.34
◳◰ Market Sentiment Index :
▣ News sentiment score is N/A
▣ Twitter sentiment score is 0.55 - Bullish
▣ Reddit sentiment score is 0.57 - Bullish
▣ In-depth NEARUSDT technical analysis on Tradingview TA page
▣ What do you think of this analysis? Share your insights and let's discuss in the comments below. Your like, follow and support would be greatly appreciated!
◲ Disclaimer
Please note that the information and publications provided are for informational purposes only and should not be construed as financial, investment, trading, or any other type of advice or recommendation. We encourage you to conduct your own research and consult with a qualified professional before making any financial decisions. The use of the information provided is solely at your own risk.
▣ Welcome to the home of charting big: TradingView
Benefit from a ton of financial analysis features, instruments and data. Have a look around, and if you do choose to go with an upgraded plan, you'll get up to $30.
Discover it here - affiliate link -

NearusdtNearing its 2nd lowest range low around 1$
Interesting chart
Wonder if zkrollups are still useful i spose..


Last support range: 0.830-1.528Hello?
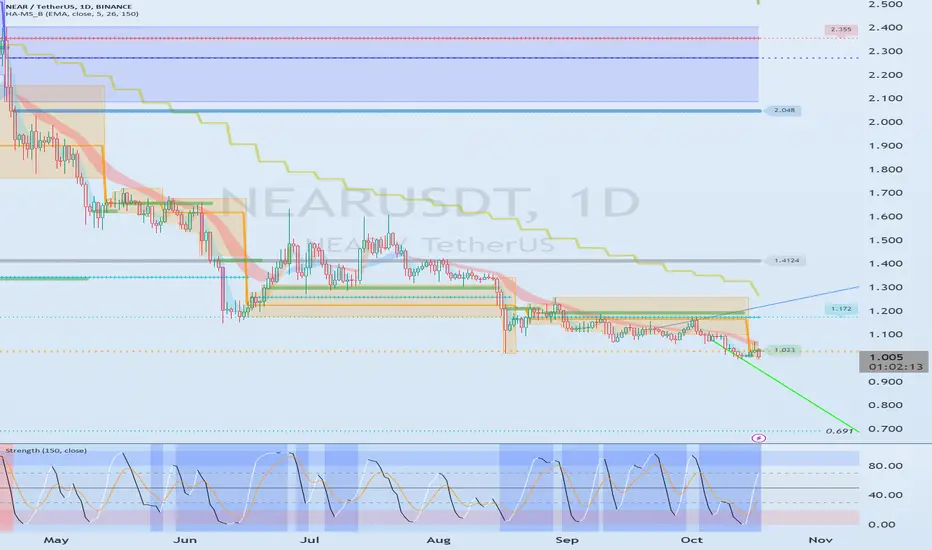
Hello traders!
If you "Follow" us, you can always get new information quickly.
Please also click “Boost”.
Have a good day.
-------------------------------------
(NEARUSDT chart)
(1M charts)
The key is whether the price can be maintained by rising above 1.99.
(1W chart)
The key is whether it can receive support and rise in the 0.830-1.528 range.
(1D chart)
Since the volume profile section is formed around 1.4124, the key is whether it can rise beyond this point.
If the price cannot be maintained by rising above 1.031, there is a high possibility of a new low, so caution is required.
-------------------------------------------------- -------------------------------------------
** All explanations are for reference only and do not guarantee profit or loss in investment.
** Trading volume is displayed as a candle body based on 10EMA.
How to display (in order from darkest to darkest)
More than 3 times the trading volume of 10EMA > 2.5 times > 2.0 times > 1.25 times > Trading volume below 10EMA
** Even if you know other people’s know-how, it takes a considerable amount of time to make it your own.
** This chart was created using my know-how.
---------------------------------
NEARUSD ❕ correctionTD Sequential formed a reversal signal down (4H TF)
Price and RSI chart formed a divergence (30m TF)
I think NEAR may continue the correction if it fixes under the support.

near/usdt 1DHello friends, the area we consider for this currency is between the prices of 0.670-0.793.
This area has good potential for price growth

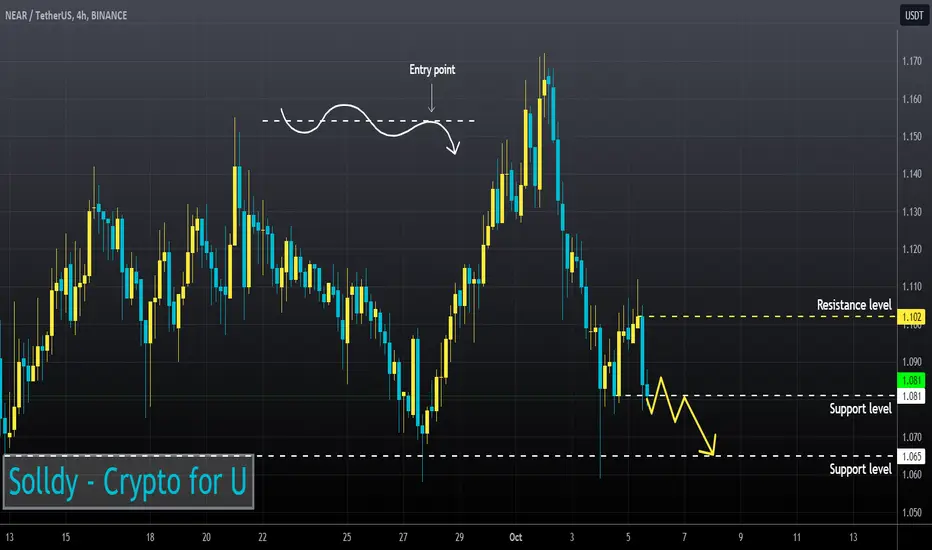
NEAR/USDT upward momentum? 👀 🚀 NEAR Today Analysis💎 Paradisers, turn your attention to NEARUSDT as it showcases intriguing dynamics, currently positioned within a demand zone and gearing up for a potential bullish ascent.
💎 Upon closer examination, we've noticed that NEAR recently touched the descending channel's resistance, which now serves as its supportive base. Furthermore, should the price surpass the 1.101 threshold, we anticipate a bullish trajectory that could challenge higher levels.
💎 On the flip side, if the price of Nearprotocol breaches the demand zone, it's likely to gravitate towards the support level. As always, strategize your trades with caution and foresight.
💎 Remember to employ prudent trading strategies and use proper stop-loss measures! Stay alert to market movements and look forward to more insights

NEARUSD ❕ bearish takeoverNEAR has fixed under 50EMA (4H TF)
RSI is moving in the sellers' zone.
I believe that the asset will continue to decline.
NEAR short term tradeNEAR has been range bound last few weeks and months. 1.08 and below is my buy zone with a stop loss below 1.078 and a profit target of 1.12 and 1.16.

Next few months idea for NEAR/USDTbased upon few calculation & liq. prospective im expecting this move. #NFA

Near Long USDT 20xNear Long USDT 20x
Entry: 1.1500
Near Long USDT
Target:
1.1610
1.1726
1.1830
1.2001
1.2202
1.2401
Sl 1.08

NEAR/USDTNEAR is screaming out long me, good R:R here, I would aim for the orange resistance line.
SL below the green line
GL

short positionThe trend is bearish and the price is recive to trend lin as a CP pattern and also we see a CHOCH
Do you agree with me?
It dosent financial advice


NEARUSD ❕ downtrendNEAR has consolidated under 50EMA (1H and 30m TFs)
RSI is moving in the sellers zone
I believe that the price chart will continue the downward movement.


Bearish on $NEARWe are at near premium (equilibrium)
We have cleared sell side liquidity.
We have bearish confirmations in terms of volume.
We have a high probability of going to below 1 levels

🔥NEAR Is About to Brake a Huge Triangle❗Most of the holders of NEAR Protocol are now at painful loss. Of course, it's good for us and the whales who want to buy cheaper.
I wouldn't decline that the price will fall below the triangle for a moment, but it doesn't make any impact on a long term picture. Bull market soon!
💥remember that fear in crypto is our biggest friend
like❤️ and follow
Check the links and get a BONUS🎁 from me👇

Near on Verge Of Massive Breakout seems like near coin has already bottomed out and getting ready for massive breakout
formed descending channel in 3 days and testing trendline expecting breakout soon
incase of successful breakout expecting massive bullish wave in midterm expecting move towards 6$ in coming months
