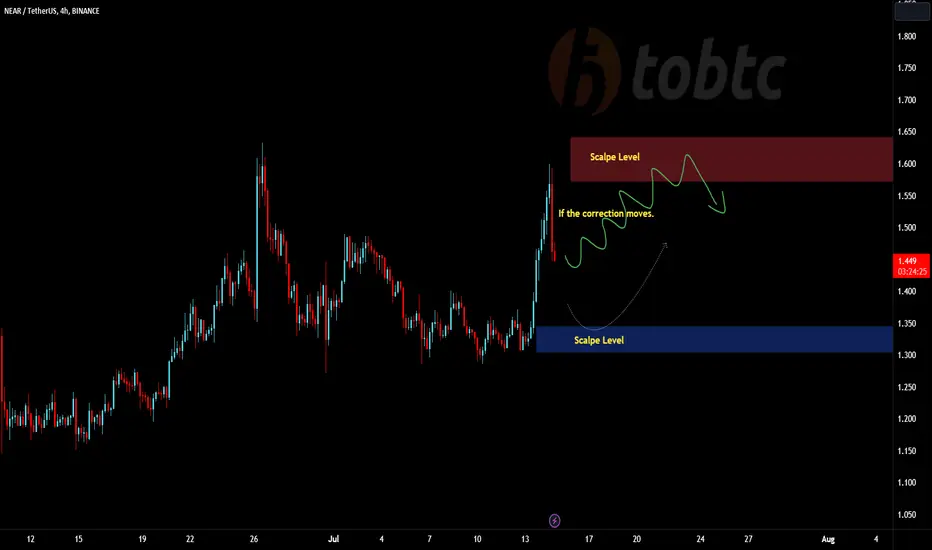
#NEARUSDT #LQR #TOBTC #LaqiraProtocolDue to the bearish momentum if correction of the market in the resistance zone.
you can open a sell position after confirming and matching with Bitcoin levels.
Scalpe support zone is also specified in the chart
After confirmation and matching with Bitcoin level
you can open long positions This analysis is not an offer to buy or sell.
NEARUSDT trade ideas
🔥 NEAR Huge Falling Wedge Break OutNEAR has been trading bearish since the April top 2022. This trade is based on the premise that NEAR's bear market is over and that the price will move up in the future. Keep in mind to wait for the price to break through the top resistance of the pattern and close above it to confirm the break out.
Target placed at the all-time highs, stop below the recent bear market lows. For less risky trade you could take (partial) profits around 6.00 and 8.00

The deal that I published before NEAR The price hit the targets , by using the technical analysis we predicted that the price will go up


NEAR | LONG 1- As we can See near near broke the (YELLOW LINE) as a resistance level
2- At the same time this level is 0.618 in Fib
3- also it's apply a double bottom and respect the order-block

NEAR medium/long term targetsNEAR seems to be primed for a good double bottom towards ATH after a possible retest to 1.229$ assuming no black-swan event occurs.

Near price comes to life!) Holders have been waiting for you)NEAR price has dropped back into the $1.20-1.30 liquidity zone
At the beginning of its trading, NEARUSDT, after breaking through this liquidity zone, began a solid and solid price growth.
In 2023, the NEARUSD price is testing this level for the third time, which is probably a strong mirror zone.
The only nuance is that in six months of 2023, the price of BTC roughly doubled from $15k to $30k, while the price of Near did not.
Therefore, keeping our fingers crossed for NEAR, we can assume that if buyers manage to hold the $1.25 level, they should be able to double the NEARUSDT price to $2.75 just to catch up with the amplitude of BTC's growth.
However, if NEARUSDT drops and consolidates below $1.20, then it's nothing personal, but the next stop from the bottom is $0.90.
_____________________
Did you like our analysis? Leave a comment, like, and follow to get more

NEARUSDT: TECHNICAL ANALYSIS.Hello traders,
Wave 5 is supposed to end at 1.151-0.525 zone. Then ABC Correction is supposed to materialise
towards the resistance zone at 13.150.
Thanks.

NEAR - is hot like hellHi guys, hope you are doing fine. Oppened long position on NEAR. Its a good project. We can see some nice bounce very soon. Does it can drop more? Of course it can. I belive 0.90$ is minimum price and then up. Its nice to accumulate NEAR right now. Regards!

TRADE OF THE DAY | NEAR Potential 7.8%TRADE OF THE DAY | NEAR Potential 7.8%
NEAR has just broken out of the local trendline with a bullish divergence printed. The RVD also is showing a breakout - good place for a long opportunity.

NEAR long 1h/4hHi. Nearusdt is ready for a long. So I put some in buy and wait for what happens next. NFA. DYOR.

NEARUSD ❕ support levelNEAR has fixed above 50EMA on the 1H TF.
RSI is near neutral values.
I believe the asset will bounce from the current support.

Looking bullish on NearusdtNear is making descending Pattern on daily timeframe.
And also we can see bullish charts on smaller timeframe 4hr and 15min.
SL below : 1.16
TP : 1.49 . 1.66 1.80

NEAR: OVERVIEWDisclaimer
High Risk Investment
Trading cryptocurrencies and Forex carries a high level of risk, and may not be suitable for all investors. Before deciding to trade cryptocurrency you should carefully consider your investment objectives, level of experience, and risk appetite. The possibility exists that you could sustain a loss of some or all of your initial investment and therefore you should not invest money that you cannot afford to lose. You should be aware of all the risks associated with cryptocurrency and Forex trading, and seek advice from an independent financial advisor. Since Any opinions, news, research, analyses, prices, or other information contained on this website is provided as general market commentary, and does not constitute investment advice. The Bibres will not accept liability for any loss or damage, including without limitation to, any loss of profit, which may arise directly or indirectly from use of or reliance on such information. All opinions expressed are owned by the respective writer and should never be considered as advice in any form.
A qualified professional should be consulted before making any financial decisions.
-------------------------------------------------------------------------------------------------------------------

NEARUSDT.P LONG POSITION Hello! Have a plane to open a long position
Have a two zones of interest
Wait a reaction and open a big long with %10+

NEARUSDTI think the price can go up to the ceiling of the channel
In the same way, he broke out the trendline and made a pullback

NEAR Trading PlanNEAR long setup
Wait for weekly RSI breakout + price action breakout before taking position

NEAR SHORT SETUPHi, dear traders. how are you ? Today we have a viewpoint to SELL/SHORT the NEAR symbol.
For risk management, please don't forget stop loss and capital management
When we reach the first target, save some profit and then change the stop to entry
Comment if you have any questions
Thank You

NEAR Long | Breaking 50EMA, potential pumpNEAR Long | Breaking 50EMA, potential pump
Short term scalp trade, showing a bit of bullish potential. We are running into some volatility with the FED announcement although it could work in favour here with a slightly bigger stop-loss given to hopefully absorb it.

NEARUSD ❕ volume decline on correctionTrading volumes declined on the price correction.
NEAR has fixed above 50EMA on 4H Timeframe.
I believe that the asset will grow after fixing above the resistance level.

NEAR shortNEAR broke trough the support level. Asset broke trough the ascending trendline. Bearish movement to support level at 1.23 is possible.

NEARUSDT → Double bottom and range breaking BINANCE:NEARUSDT forms several key setups which are quite strong prerequisites for further growth. What to expect from the price?
A double bottom is forming at the level of 1.229. The formation period is 7 months. Price is accumulating a huge amount of energy during this period while a range (consolidation) of 1.229-2.596 is forming.
At the same time the price breaks the resistance of the descending wedge. In that case, if the bulls hold their positions above the previously broken line, we will see a rise to the upper boundary of the range in the medium term. A breakout of 2.596 will take the price to 3.361.
The moving averages are still as resistance, but MA-50 has been tested and may be broken soon.
Support levels: the previously broken range boundary, the level of 1.229
Resistance levels: MA-50, 1.800, MA-200
I expect predictable reaction from the bulls. A consolidation above the previously broken line will form an entry point to long positions, and after that I will wait for an increase to resistances.
Regards R.Linda!
