NEARUSDT trade ideas

NEAR looks like it's about to take off!NEAR looks a lot like other coins with made their way to touch the 200 EMA on the 1D. If BTC remains put it might give this a pump so watch out. as always DGR (Don't get REKT)


Near top top 🌳🌪️The technical analysis currently reveals a promising bullish trend in the NEAR market. The price is approaching a long-term simple moving average (SMA) and demonstrates a strong bounce. This positive momentum could lead to the appearance of "golden crosses", where a short-term SMA crosses above a longer-term SMA (another strong line). These technical signals bolster optimism for the continuation of the ongoing upward trend in NEAR.
On some day, it will jump

Significance of the 2.240-2.328 intervalHello?
Traders, welcome.
If you "Follow", you can always get new information quickly.
Please also click "Boost".
Have a good day.
** Analysis of the BTC chart publishes new ideas once a week.
** However, we publish new ideas when volatility occurs or when we show signs of diverging from our expectations.
** Excluding the above situation, BTC analysis is listed as a daily update.
-------------------------------------
(NEARBTC 1W Chart)
The key is whether it can rise above 0.0000 9561 to 0.0001 0554.
-------------------------------------------
(NEARUSDT chart)
You can see that a volume profile section is formed around 2.240-2.328.
So, the question is whether it can sustain the price by moving above 2.328.
The area around 3.198 is an area where you can buy in long-term terms.
So, a rise to 3.198 is the target for now.
-------------------------------------------------- -------------------------------------------
** All descriptions are for reference only and do not guarantee profit or loss in investment.
** Even if you know other people's know-how, it takes a considerable period of time to make it your own.
** This is a chart created with my know-how.
---------------------------------

Nearusdt Breakout Soon Nearusdt
NEAR/USDT is currently forming a symmetrical triangle pattern, which suggests that the price is consolidating and preparing for a potential breakout. If the breakout is successful, we can expect to see a bullish move in the coming days or weeks. However, as with any market, there is always a risk involved, and proper risk management should be used when trading.
It's important to wait for confirmation before entering any position. A confirmation in this case would be a strong bullish candlestick closing above the upper trendline of the symmetrical triangle pattern. On the other hand, a failed breakout could lead to a downside move, and traders should be prepared for both scenarios.
Overall, the symmetrical triangle pattern in NEAR/USDT suggests that a breakout is imminent, and traders should keep a close eye on this market for potential trading opportunities. As always, it's recommended to conduct your own research and use proper risk management techniques before making any trades.
If You are satisfied with our work join us

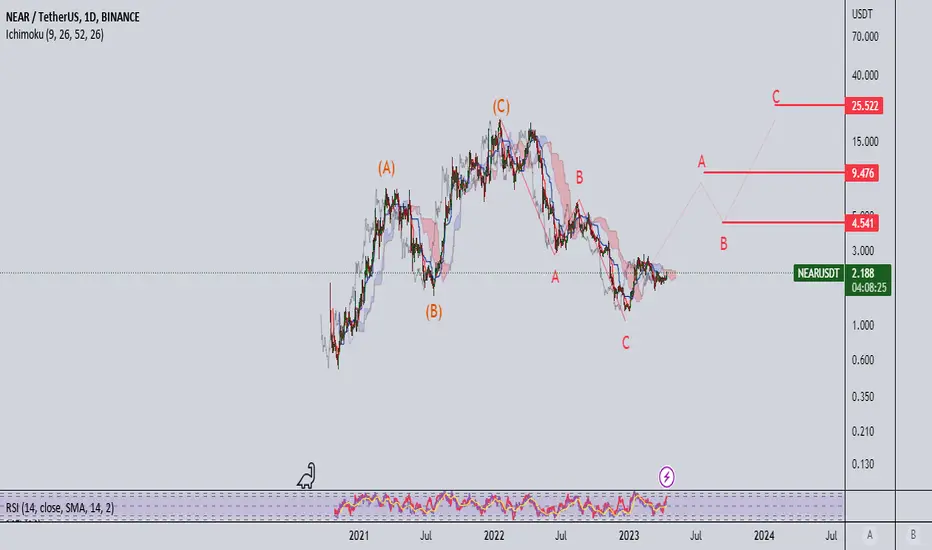
NEARUSDTclassic wave pattern could be accured as N PATTERN (or ABC) and its on the Third wave which is C and might be filled as I show on the chart and the targets are mentioned as well
NEAR Triangle-Pattern" S&R in short-term>?>I Have Tried My Best to Bring the best Possible outcome in this Chart.
NEAR can continues to rising price in case of break It"s T-Pattern.
Everything We need's cleared on the chart.
Must important level's marked on the chart.
It's just an analyze,
Not a financial advise.
PLZ DYOR
With hopping success>>>>>>>>>

Near breaking Trend Line Seems Like Getting ready For massive Bullish impulse
Testing trendline in daily timeframe incase Of breakout expecting 120 to 140% bullish move

NEAR - Road to 2024Already down 90% and it looks like it will be a long crypto winter HOWEVER this is a long term trade and imo it’s time to DCA.

NEAR longNEAR bounced off the ascending trendline. Asset broke through the descending trendline. Bullish movement to resistance level at 2.2 is possible.

NEARThe entry point is from the price of 1.92, the stop loss is at 1.89, and the target is 2.10. Please adhere to the deal

NEAR/USDT with a potential drop to happen! Good morning guys 👋
another one on our watchlist today is going to be NEAR coin. we have been looking at this one for a week already where we failed to seek a good entry for a drop but we now we are looking from another angle. Price got rejected from 100ema where it is going for that trend currently. Waiting for this trend to be broken which could lead to further drop!
If you like ideas provided by our team you can show us your support by liking and commenting.
Yours Sincerely,
Swallow Team 🔱
Disclamer:
We are not financial advisors. The content that we share on this website are for educational purposes and are our own personal opinions.

#Near Wait to exit the cornerWait, if you leave the corner and stabilize above 2.34, which is the entry point, you can buy targets 1 and 2.

Near Protocol coming down?Based upon the daily time frame I see multiple levels of confluence forming, the measured move projected from the inverted cup and handle suggest a move back to 0.68 cent. Stay tuned

