NEARUSDT trade ideas

NEAR USDTNEAR is trading below a trendline from December, currently holding within the blue support zone at $2.091–$2.350.
A breakout above the trendline and $2.712 resistance could trigger bullish momentum. The key resistance at $3.563, which previously acted as strong support, could pose a challenge. After breaking below, the price consolidated under this level for 28 days before declining further. A breakout with volume could push the price toward higher levels marked on the chart.

UniversOfSignals | NEAR: Weekly Timeframe 👋 Welcome to UniversOfSignals !
Today's analysis will focus on NEAR, a Layer 1 and AI crypto project with a market cap of $3.17 billion, ranking 31st on CoinMarketCap.
📅 Weekly Timeframe
In the weekly timeframe, as you can see, following an upward leg from $0.993 to $8.298, a range box formed over a year from $3.615 to $8.298. Recently, with the market's downturn, the price finally broke below this box's floor at $3.615.
✅ Currently, the price has pulled back to this area after breaking $3.615 and has dropped to $2.574, where it's currently forming a supportive green candle.
⚡️ The $2.574 area is robust, showing positive price response, and it remains to be seen what happens next. If this support breaks, the price could move towards lower areas like $1.830 and $0.993.
🔑 Conversely, if the price can sustain this support and move above $3.615, a significant upward momentum could enter the market, potentially driving the price at least up to $8.298. A break above $8.298 could see the next target at $16.839.
📊 Market volume has increased following the range break, which is natural as the price has finally moved out of a range, and increased volume has entered. Continuation of this volume increase could heighten the likelihood of breaking $2.574.
📝 Final Thoughts
This analysis reflects our opinions and is not financial advice.
Share your thoughts in the comments, and don’t forget to share this analysis with your friends! ❤️

universOfSignals | NEAR: Breaking Boundaries in Layer1 AI Crypto👋 Welcome to universOfSignals !
Today's analysis will focus on NEAR, a Layer 1 and AI crypto project with a market cap of $3.17 billion, ranking 31st on CoinMarketCap.
📅 Daily Timeframe
In the daily timeframe, we can observe more detailed price movements.
💫 As seen, the main support at $3.615 has broken, and subsequently, a price box formed between $2.804 and $3.615. Coinciding with an RSI divergence, the floor at $2.804 broke, and the price dropped to $2.161.
🎲 Currently, the price is correcting back towards the $2.804 area. Market volume is rising, and the RSI divergence trigger has not yet been activated, indicating ongoing bearish momentum.
💥 If the RSI breaks the 50 area, the divergence could impact the market and eliminate the bearish momentum. This would be the first sign of a trend change, but the main ceiling at $3.615 must be broken to confirm a trend reversal.
📉 For short positions, breaking the $2.161 area is suitable, and if this area breaks, the price could drop to $1.682. For long positions, breaking $2.804 is a risky trigger, with the main trigger at $3.615 for a more solid position.
📝 Final Thoughts
This analysis reflects our opinions and is not financial advice.
Share your thoughts in the comments, and don’t forget to share this analysis with your friends! ❤️

TradeCityPro | NEAR: Breaking Boundaries in Layer 1 AI Crypto👋 Welcome to TradeCityPro!
Today's analysis will focus on NEAR, a Layer 1 and AI crypto project with a market cap of $3.17 billion, ranking 31st on CoinMarketCap.
📅 Weekly Timeframe
In the weekly timeframe, as you can see, following an upward leg from $0.993 to $8.298, a range box formed over a year from $3.615 to $8.298. Recently, with the market's downturn, the price finally broke below this box's floor at $3.615.
✅ Currently, the price has pulled back to this area after breaking $3.615 and has dropped to $2.574, where it's currently forming a supportive green candle.
⚡️ The $2.574 area is robust, showing positive price response, and it remains to be seen what happens next. If this support breaks, the price could move towards lower areas like $1.830 and $0.993.
🔑 Conversely, if the price can sustain this support and move above $3.615, a significant upward momentum could enter the market, potentially driving the price at least up to $8.298. A break above $8.298 could see the next target at $16.839.
📊 Market volume has increased following the range break, which is natural as the price has finally moved out of a range, and increased volume has entered. Continuation of this volume increase could heighten the likelihood of breaking $2.574.
📅 Daily Timeframe
In the daily timeframe, we can observe more detailed price movements.
💫 As seen, the main support at $3.615 has broken, and subsequently, a price box formed between $2.804 and $3.615. Coinciding with an RSI divergence, the floor at $2.804 broke, and the price dropped to $2.161.
🎲 Currently, the price is correcting back towards the $2.804 area. Market volume is rising, and the RSI divergence trigger has not yet been activated, indicating ongoing bearish momentum.
💥 If the RSI breaks the 50 area, the divergence could impact the market and eliminate the bearish momentum. This would be the first sign of a trend change, but the main ceiling at $3.615 must be broken to confirm a trend reversal.
📉 For short positions, breaking the $2.161 area is suitable, and if this area breaks, the price could drop to $1.682. For long positions, breaking $2.804 is a risky trigger, with the main trigger at $3.615 for a more solid position.
📝 Final Thoughts
This analysis reflects our opinions and is not financial advice.
Share your thoughts in the comments, and don’t forget to share this analysis with your friends! ❤️

Short NEARNEAR is bouncing off the resistance level and the descending trendline. Bearish movement to support level at $2.14 is expected to happen!

$NEAR - Approaching key liquidity levels. #NEAR has created a BOS, followed by a drop into our POI, which has provided a nice 21% bounce. It’s a level where one can spot-buy NEAR. Personally, I’d only look for longs from the 3M HOB refined into MTF or the demand level just below it.
Other info., such as TPs and entries, is provided in the chart.
I’ve noticed that people usually miss Supply and Demand levels, and if there’s one thing I’ve learned in this recent correction, it’s that these levels, if reached, are highly respected - especially if there’s an OB/HOB at the same level. The best example of this is #ETH, which found support at the 3M Demand level, proving the significance of S&D versus just looking at individual liquidity levels.

Idea No. 1 for the spotNear protocol, the price has been rising for 186 days and already 327 days in a sideways correction. The correction phase is in the form of ABC waves, but it is very tedious.
If we consider the Elliott waves, there is nothing except the first and the current second, we can suggest the third one, but then we are waiting for a bull of incredible size.
What at the moment gives us the idea to buy?
- touching the support zone
- RSI is almost oversold.
- A future possible bullish MACD crossover.
- ADX is about to show a trend, but the decline has already happened.
What about the fundamentals ?
Basically strong asset, in top 30.
MС 4.44B, good volume and liquidity.
It is clear that when the asset was 20$, tokens were 2 times less and capitalization was 12B, but 3 years passed and volumes increased everywhere, liquidity became more, cellular ETF and retail funds broke into our chat + in addition the US president launched his meme.
So seeing a $15 price with MС 18B in the next quarter or two is not hard to see. If we talk about ATN update, it's a breakdown of MС 25B and a shift to about 9th place of the top, this is quite realistic, but still more likely there will be an extensive liquidity inflow into other projects as well.
Consider your risks
DYOR
Translated with DeepL.com (free version)

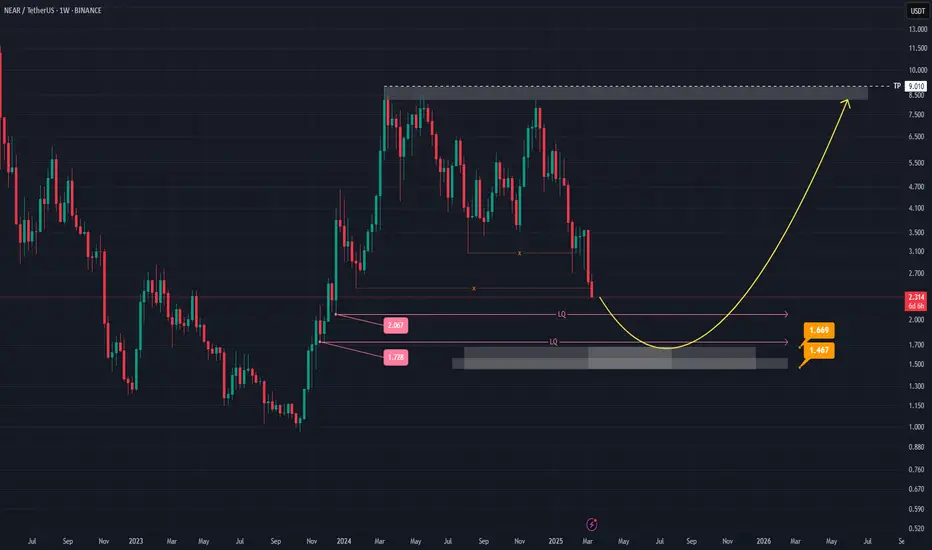
NEAR (NEARUSDT) Weekly Analysis: Potential Reversal in SightHey everyone! Let’s take a look at NEAR (NEARUSDT) on the weekly chart. There’s a chance the price might move into the 1.728–2.067 range, possibly sweeping up some liquidity before heading toward the 1.467–1.669 zone. This area seems like it could act as a launchpad for a potential bounce, aiming for higher targets afterward.
Watch for a spike in trading volume around that zone—if volume picks up, it could indicate stronger buying interest. Another key signal to look out for is a bullish candlestick pattern (like a hammer or a bullish engulfing), which might confirm a reversal if it appears near the 1.467–1.669 level.
Of course, if the price drops below 1.467, it might change this outlook and suggest a different path forward. Since the market can be unpredictable, it’s always important to keep an eye on these levels and stay prepared.
Above all, remember to do your own research and stay informed—this space can move fast, and it’s best to approach it with a curious mind. Keep learning, stay positive, and good luck out there! 📈
Long On NearTaking a long position on NEAR at 50% of the unfilled wick as seen on chart. It is a little risky setup however with tight stop loss therefore I see this as a no brainer to give it a try. Take partials as you wish or use liquidity/fibonacci retracement for reference.

NEAR/USDT BUYHello friends
Due to the price correction, we have identified important supports for you that are likely to reverse the price, and you can buy steps according to the two specified ranges.
We have also identified price targets for you.
*Trade safely with us*

NEAR Protocol Prepares For Long-Term Reversal (Bullish Breakout)NEAR Protocol (NEARUSDT) has been in a correction pattern since March 2024. It has been sideways within a wide range for an entire year.
The baseline, or long-term support, matches the 0.786 Fib. retracement level for the bullish wave that developed between late 2023 and early 2024. Current price action is happening above this level. Once resistance turned support.
The lowest price since January 2024 was hit just four days ago, 4-March. While this level was a more than a year long low, trading volume was very low. Even on the 2-Feb. drop bear volume was already dropping. Ever since the peak in March 2024, with each successive drop this pair produces, trading volume continues to drop. Revealing a weakening bearish trend.
A trend weakens when it is reaching its end.
But this isn't really a bearish trend but more like a long-term, wide consolidation pattern. It is classic pre bull-market action. There is a long-term lower high but the bottom is flat. When the next bullish wave develops, which is what will happen as the correction ends, the candles that we are seeing now will become almost invisible, same as if you were to look to the deep left side of the chart. Each time bull-market action develops, the preceding candles become really small. This is because bull-markets tend to produce growth that is out of proportion will all previous price action.
NEAR Protocol will hit new All-Time Highs. This is certain. It will be amazing and this amazingness is starting in a matter of days.
It will take months and months and months for the complete bullish cycle to reveal itself, but it will start within days. It tends to start low. Slowly but surely momentum grows, and as if it was never happening, the next moment we are here trading and exchanging, the entire market is experiencing growth.
We will be chatting and exchanging, having fun as our profits grow.
Thank you for reading.
Allow me to be your guide. It will be a tour that will not only change our lives but also the world.
Namaste.

NEARUSDT is BullishPrice was moving in a downtrend, however a strong bullish divergence with double bottom pattern has emerged on daily timeframe hinting the return of bulls. If previous lower high is broken with volume then we can expect a bullish reversal as per Dow theory. Targets are mentioned on the chart.

NEAR (Near Protocol); my notes for long-termIt doesn't look good in the short term, 2.1 and 2.7 are strong supports, there is still no problem as long as these are not lost. If the bull pennant is completed for the long term, I will follow the targets of 6.3 - 9 - 13 - 19 - 29 - 52 respectively. Here, I see the most important levels as 13 and 19 dollars. Spot CVDs should be examined carefully at these prices.
Not investment advice.

NEAR - Bullish Movement Soon!NEAR has been overall bearish from both long-term and short-term perspectives, trading within the falling channel marked in red.
However, it is currently hovering around a support level, the lower trendline, and the key $3 round number, so we will be looking for longs on lower timeframes.
For the bulls to take over in the short term, a break above the last minor high at $3.025 is needed.
For the bulls to remain in control in the medium term, a break above the $3.65 major resistance is required.
Disclaimer:
This content is for informational purposes only and should not be considered financial or investment advice. Always do your own research and consult with a professional before making any investment decisions.

nearMy personal opinion is this: If it wants to lose this area, it can probably go as far as the support floor we identified. Inside the area, it's important not to lose these two blue lines.

NEARUSDT 12H#NEAR is moving inside a falling wedge pattern on the 12H chart and is on the verge of breaking out above the 12H MA50 and pattern resistance.
Short-term targets:
🎯 $4.048
🎯 $4.807
🎯 $5.421
Mid-term targets:
🎯 $6.035
🎯 $6.908
🎯 $8.021

Near Same Sell RepeatationNear coin is repeating its sell pattern again and again.
There are three things to consider.
1-Down there at 2.4 a good Ob is waiting for this coin.
2-Market is consolidating and also manupilating but not distributing
3-This lead to pattern repeatation and market momentujm downwards.
Note.
Not to worry as there is super ob down there buy from that and minimum gain is 30 percent
while maximum gain is about 70 percent and you should hold till that gain if you bought from
obs down there.

Short termSupport: $3.2, $3.0, $2.8
Resistance: $3.4
Entry (Short): Below $3.2 or rejection at $3.4
Take Profit (TP): $3.0, $2.8
Stop-Loss (SL): Above $3.4

Near is in trouble?Support Zone: 2.036
Resistance Levels: 4.000 (Bearish Order Block), 5.000
Entry: After a breakout above the descending trendline
Take Profit (TP): 4.000, 5.000
Stop-Loss (SL): Below 2.800

A clear level to watch outNEAR obviously looks interesting at this point, but i'm still expecting a deeper level in order to get on it.
Algo targets around 2.3/2.4, and 1.75/1.64, also confluent with the golden pocket retracement.
NFA

NEARUSDT short HI, guys the market is bleeding a lot due to the failure of US bitcoin reserve. I come up with NEARUSDT shorting opportunity the idea clear in the chart that we have been consolidating 3.6 and 3.00 USDT and now we get a breakout to the downside if we geta pullback to the 3.00 zone we have a great chance of shorting opportunity, but we need short time frame confirmation.
stay safe.
risk what you can afford to lose.
use 1% risk of your trading account.
share your idea in the comment

NEARUSDT on a bullish climb!
🚀 The price BINANCE:NEARUSDT.P is moving steadily inside an ascending channel, testing *3.080 USDT* resistance. If the breakout holds, we could see a push toward higher levels!
🔑 *Key Levels:*
**Support:**
*3.051 USDT* – main level keeping the trend intact.
*3.000 USDT* – deeper support if retracement kicks in.
**Resistance:**
*3.094 USDT* – key breakout point.
*3.150 USDT* – potential next stop for bulls.
🚀 *Trading Strategy:*
*Long Entry:* After confirming a breakout above *3.094 USDT*.
*Stop-Loss:* Below *3.051 USDT* – protecting against fakeouts.
*Profit Targets:*
*3.120 USDT* – quick scalp target.
*3.150 USDT* – solid take-profit zone.
*3.200 USDT* – full bullish extension if momentum builds.
📊 *Technical Outlook:*
Price respecting the channel = continuation likely.
Volume picking up – signals increasing bullish interest.
Failure to break resistance could lead to a pullback to support.
💡 *What to Watch?*
Watch for volume confirmation on breakout!
If resistance rejects, look for a retest at lower support before re-entering.
Bulls in control, but risk management is key.
Are we heading for a breakout or a pullback? Drop your thoughts! 🚀🔥
