Near 1:12 weekly setupTo me this is an area where I want to look for a swing position. Monitoring at lower tf to get a decent entry
NEARUSDT trade ideas
LongAccording to the analysis of the waves and the use of the Gann method and price data analysis, it seems that we can expect the price to return to the green zone on the chart.
This analysis is only my personal opinion. Please do not set your own trading criteria and act based on your personal strategy.
Be successful and profitable

NEARUSDT LONG scalpthe previous resistance has been broken and retesting that level, so I am thinking about entering long position. this is just to share idea.

NEAR/USDT Short Trade Setup – 15-Minute Chart AnalysisThis trade setup on NEAR/USDT is based on a potential short opportunity observed on the 15-minute timeframe. The price is currently at $3.14, with a clear risk-to-reward ratio defined. The stop-loss is positioned above the recent high, while the take-profit target extends toward a lower support level. The setup aligns with a structured approach to swing trading, ensuring risk management principles are in place. This trade anticipates a potential downside move, leveraging momentum shifts for an optimal entry. Always manage risk appropriately and trade with a clear plan.

Univers OF Signals | Let's take a quick look at NEARLet's take a quick look at NEAR, currently with a market cap of $3.76 billion, ranked 32nd in coin market cap.
🔍 As you can see, after a downward leg that started following the break of $4.258 and continued down to $3.126, the market has entered a ranging phase.
✨ The support level at $3.126 is critical, and breaking this support could offer a good opportunity for a short position. The next support level would be at $2.690.
🔼 If the price stabilizes above the $3.585 area, it could undergo a deeper correction upwards. The important resistance zone right now is between the 0.5 and 0.618 Fibonacci levels, which I have marked on the chart.
📉 However, if the price aims to rise further and start an upward trend, it must overcome resistance at $4.258 and $4.870 to demonstrate that buyers have the upper hand.
📊 Volume in the range box is decreasing, which is normal; once this volume reaches its lowest, a breakout of the appropriate triggers will select the next direction for the price.
🥸 The RSI oscillator is also nearing the 30 area, and if it moves into the oversell zone simultaneously with the break of $3.126, it would serve as a strong confirmation for a short position momentum

Near Protocol AnalysisNear Protocol Analysis:
Near Protocol is currently trading at 3.565, having recently broken through a critical support level. This breakdown has altered the technical structure of the asset, as the price now appears to be retesting the previously breached support zone, which has since transformed into resistance. In technical analysis, such a retest of a broken support level often serves as a key confirmation point for potential trend continuation. Should the current candle close decisively below this newly established resistance level, it could indicate a resumption of the bearish momentum, potentially paving the way for further downward movement.
It is important to consider that the reliability of this bearish outlook will depend on several factors, including the volume accompanying the price action and the broader market sentiment surrounding Near Protocol. Traders should also remain cautious of any signs of rejection or potential reversal patterns at this critical juncture, as these could invalidate the bearish thesis and suggest a shift in market dynamics.
In conclusion, while the current price action suggests a potential continuation of the downtrend.
We would be interested in hearing your perspective on this analysis and whether you concur with the potential bearish outlook for Near Protocol. As always, trade responsibly and prioritize risk management.

NEAR 3D CHARTBINANCE:NEARUSDT
We have a rebound from an important support zone I think it will have good movement after crossing $3.9, $4 and back above the line .
This is just an opinion about the currency and is not considered investment advice.
Your decision is your responsibility

NEARUSDT 1WNEAR ~ 1W Analysis
#NEAR Test this support block. If you still have a Conviction on this Coin, Maybe this is the right time to start buying back with a minimum target of 20%+

near start upIt starts to rise and will continue until 7.. Now the coin is at the bottom and has the potential to grow by 300%.

Trading opportunity for NEARUSDTBased on technical factors there is a Buy position in :
📊 NEARUSDT
🔵 Buy Now
🪫Stop loss 3.000
🔋Target 4.000
📏 R/R 1,8
💸RISK : 1%
We hope it is profitable for you ❤️
Please support our activity with your likes👍 and comments📝

$NEAR Ready for ATH🚀 NEAR Chart Update 🚀
We entered below $1, and the price soared to $9!
x.com
Now, #NEAR is catching our attention once more.
Consider (DCA) in the zone of $2.5-$3. 🔄
#HODL for the all-time high 🚀
please like, follow, and repost to keep me motivated
#NFA
#DYOR

NEAR/USDT 1W🩸 CRYPTOCAP:NEAR ⁀➷
#NEARProtocol. Macro chart Another
💯 Intermediate Target - $12
🚩 Macro Target 1 - $18
🚩 Macro Target 2 - $30
🚩 Macro Target 3 - $46
- Not financial advice, trade with caution.
#Crypto #NEARProtocol #NEAR #Investment #L1
✅ Stay updated on market news and developments that may influence the price of NEAR Protocol. Positive or negative news can significantly impact the cryptocurrency's value.
✅ Exercise patience and discipline when executing your trading plan. Avoid making impulsive decisions driven by emotions, and adhere to your strategy even during periods of market volatility.
✅ Remember that trading always involves risk, and there are no guarantees of profit. Conduct thorough research, analyze market conditions, and be prepared for various scenarios. Trade only with funds you can afford to lose and avoid excessive risk-taking.

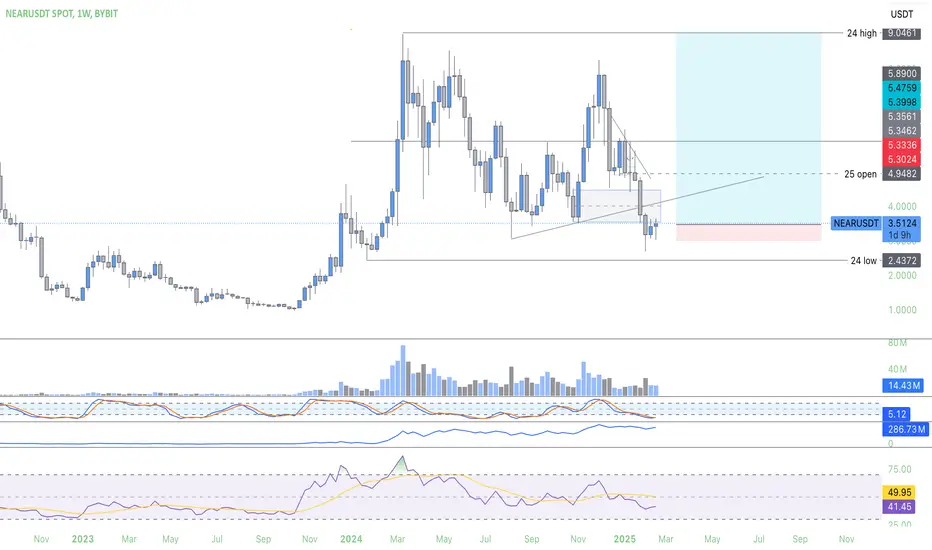
SPOT NEAR LONG 9.01.2025Pinning after abnormal activity.
🎯Purpose:
4.496
I'll let you know when I record it manually.
‼️Risk per trade: 1% of the allocated funds for spot trading.
Thank you!

NEARNEAR Protocol facilitates a wide range of applications, including decentralized finance (DeFi), gaming, digital asset management, and identity solutions. It serves as a scalable platform for building decentralized applications (dApps) with transparent and secure transactions.
Main use cases:
Decentralized Finance (DeFi) Several DeFi initiatives are powered by NEAR Protocol, enabling fast and inexpensive transactions. It supports decentralized exchanges (DEXs), lending platforms, and yield farming, giving users access to scalable and safe financial solutions without intermediaries. For example, Flux is a DeFi platform built on NEAR.
Non-Fungible Tokens (NFTs) The protocol allows for the creation and exchange of NFTs with fast transaction speeds and minimal costs, making NEAR a popular choice for digital art, gaming platforms, and collector markets1. Mintbase is a prominent example of an NFT marketplace built on NEAR.
Decentralized Applications (DApps) NEAR facilitates the creation of DApps in several sectors, including social media, gaming, and healthcare1. Its developer-friendly environment makes it easy to create and implement applications that prioritize scalability and user experience.
Decentralized Autonomous Organizations (DAOs) NEAR makes the creation and administration of DAOs easier, providing community-driven decision-making, automated governance, and transparency through smart contracts.
Scalable Gaming Solutions The protocol provides a scalable framework for games built on the blockchain, enabling developers to create games that need quick, smooth transactions, improving the overall gaming experience1. Projects like Paras utilize NEAR to build decentralized gaming ecosystems, offering players ownership of in-game assets and enabling seamless transaction.
Cross-chain interoperability NEAR's Rainbow Bridge makes interoperability with other blockchain networks, including Ethereum, possible. This allows assets to move smoothly between chains, creating new opportunities for DeFi applications and projects in other ecosystems. Using Chain signatures, assets can be traded across chains simply by swapping the ownership of NEAR accounts that control funds on different blockchains.
Open Web Development By offering web3 project infrastructure, NEAR seeks to promote a more accessible, open, and user-owned internet1. It assists programmers in creating apps that guarantee user ownership, transparency, and data privacy.
the summery of the price action is that near protocol will still drop to 1.23$ zone before another pick in price.

NEAR USDTNEAR remains strong on the high timeframe after a solid performance last year.
On the mid-time frame, it’s still consolidating within the wide $3-$8 range.
With liquidity now cleared below, all eyes are on this zone to see if a breakout is coming.


NEAR GETTING READY TO EXPLODEExpected wave C of micro (ii) to be completed and NEAR may soon explode!!!

near/usdtin my opinion, near and all crypto market will fall and I think the entire crypto market will fall, because btc.d is rising up.
And also the policy of the US government is to cover the budget deficit and the depreciation of the dollar from the pockets of the people as usual.
That is why they increased the price of Bitcoin so that more money enters the market
When more money enters the market, they reduce the price and collect their profits.
In general, the Bitcoin market will be bearish for now and until the dominance of Bitcoin falls, altcoins will be in a disastrous situation
Because when Bitcoin was $64,000 three years ago, altcoins were at their historical ceiling, but now, even though Bitcoin has exceeded $100,000, they are spending at the bottom of 2020

NEAR IS READY TO MAKE A MOVE !!!Currently we got a Change Of Character on #NEARUSDT on 4hrly time frame, which indicates the sign of strength.
By this, we may see #NEAR tapping into it's support and then bullish move upto targets as mentioned in chart

NEAR: The Complex Case#NEAR has a complex chart, the rise since Oct 2023 doesn't appear motive in any realistic way.
As long as the price stays above $3.50 (the stop-loss), targeting $14.67 is expected, with $8.25 as a key confirmation level.
Breaking $3.50 invalidates this idea.
#NearProtocol

Don't miss our analysis.Opportunities will not repeat. If they do, they will take time.
Now the same opportunity has repeated itself for a good profit.
It is an attractive area to buy.
Enter with confirmation.

NEAR/USDT | 1W🩸 CRYPTOCAP:NEAR ⁀➷
#NEARProtocol. Macro chart Another
💯 Intermediate Target - $12
🚩 Macro Target 1 - $18
🚩 Macro Target 2 - $30
🚩 Macro Target 3 - $46
📍
- Not financial advice, trade with caution.
#Crypto #NEARProtocol #NEAR #Investment #L1
✅ Stay updated on market news and developments that may influence the price of NEAR Protocol. Positive or negative news can significantly impact the cryptocurrency's value.
✅ Exercise patience and discipline when executing your trading plan. Avoid making impulsive decisions driven by emotions, and adhere to your strategy even during periods of market volatility.
✅ Remember that trading always involves risk, and there are no guarantees of profit. Conduct thorough research, analyze market conditions, and be prepared for various scenarios. Trade only with funds you can afford to lose and avoid excessive risk-taking.
