Alikze »» Near | Ascending channel - 1W🔍 Technical analysis: Ascending channel - 1W
📣 BINANCE:NEARUSDT currency is moving in an ascending channel on the weekly time frame.
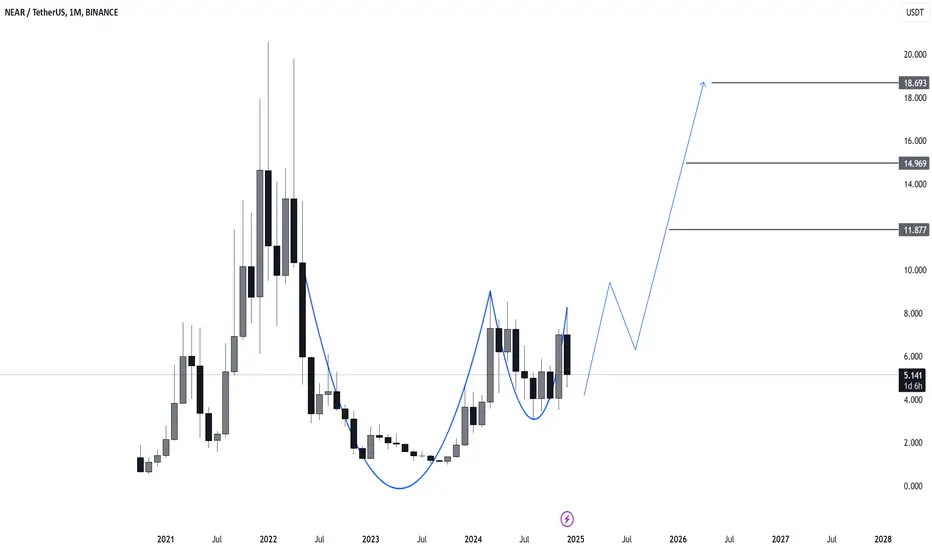
🟢 After hitting the channel ceiling and the supply zone, it encountered selling pressure, which extended the correction to the middle of the channel. After that, it encountered demand again in the middle of the channel.
🟢 It is currently facing demand in the green box, which can grow to the channel ceiling in the first step and continue its growth again to the supply zone.
🟢 Considering that the supply zone and the channel ceiling have already been consumed, in case of high momentum, it will be able to break the supply zone
🟢 After that, it can grow to the next supply zone.
💎In the first step, then after breaking the ceiling of the first ascending channel, it can continue its growth to the middle of the second channel with a pullback to it and finally to the width of the first channel to a larger supply zone.
»»»«««»»»«««»»»«««
Please support this idea 💡 with a LIKE 👍 and COMMENT 💬 if you find it useful and Click "Follow" on our profile if you'd like these trade ideas delivered straight to your email 📧 in the future.
Thanks for your continued support.🙏
Best Regards,❤️
Alikze.
»»»«««»»»«««»»»«««
NEARUSDT trade ideas

buy nearhello guys
Considering the strong upward lag that we had, we are now buying in the 3 specified areas by correcting the price and moving to the specified targets.
Don't forget capital management.
Be successful and profitable.

Near, New words which charts toldLook carefully the trend or path Drawed uncertainly just with feelings which has been came from my experiment in watching charts without any line and patterns and indicators like A Painter without any knowledge

Wave 4 It is possible that once again the level of 4.5 to 4.3 dollars
It should be tested by the market maker. But the beginning of wave 5 is more likely. The minimum movement is up to 11.9 dollars.

NEAR plan This is my NEAR plan. I expect us to stay in the orange box and consolidate here a few days before going up.

NEAR/USDT Poised for Bullish Breakout: Ascending Triangle in Foc
#NEAR Protocol is trading within an ascending triangle pattern, a bullish continuation setup.
The MA 50 is acting as support, and a bounce from this level could signal the beginning of a strong recovery.
Potential Breakout Targets 📈
🎯 Target 1: $5.70
🎯 Target 2: $7.00
🎯 Target 3: $8.40
NEAR Protocol NEAR
Comprehensive Analysis of NEAR Protocol (NEAR/USDT) ✨⚡
Introduction NEAR Protocol is an innovative blockchain project that has gained a prominent place in the cryptocurrency market by focusing on scalability, high efficiency, and cost reduction. Today's analysis examines the technical trend of NEAR in the weekly timeframe and identifies the best entry and exit points. ✨⚔️
1. Technical Analysis
1.1 Key Support and Resistance Levels
Support:
NEAR is currently at a key support level around the 0.618 Fibonacci retracement (4.832 – 4.993 USD), making it an important entry point. ✨
If this support is lost, the price may drop to the bottom of the range box (3.099 – 3.580 USD).
Resistance:
The first significant resistance is the yellow zone (5.369 – 5.731 USD), which poses a barrier to further price ascent. A breakout of this resistance on the daily timeframe could confirm a step-by-step entry strategy.
The primary resistance is at the red zone (7.380 – 8.430 USD), overlapping with the top of the range box. A breakout above this level could trigger a bullish wave toward Fibonacci targets.
1.2 Bullish Targets (Targets)
First target: Fibonacci 1.618 (11.921 – 13.771 USD) 🌟
Second target: Fibonacci 2.272 (20.273 – 23.379 USD) 🌈
1.3 Bearish Scenario
If the key support levels are lost, the price could fall to the second gray support zone (1.715 – 1.940 USD). ⚠
2. Indicators and Momentum
2.1 RSI Indicator
The RSI is currently in the supportive range (45.63 – 49.42), indicating increasing momentum. If RSI enters the overbought zone (76.83 – 79.85), it could signal the start of sharp movements toward the aforementioned targets. 🔥
2.2 Volume
Volume plays a key role in confirming resistance breakouts. If there is an increase in volume near resistance levels, the likelihood of a breakout is higher. Otherwise, the price may remain within the current range box.
3. Entry Strategy and Risk Management
3.1 Entry Strategy
Step-by-step entry:
Initial entry within the support zone (4.832 – 4.993 USD)
Add volume if the yellow resistance (5.369 – 5.731 USD) is broken
Final confirmation:
Breakout of the red resistance (7.380 – 8.430 USD) and increase volume.
3.2 Risk Management
Stop-loss:
Place the stop-loss at the bottom of the range box (3.099 USD).
Risk-to-Reward Ratio:
A minimum ratio of 1:3 for the proposed entries.
4. Future Price Movement Predictions (Scenarios)
Bullish Scenario
A breakout above the yellow resistance and stabilization above it could push the price to the top of the range (7.380 – 8.430 USD).
A move past the range top would start a bullish trend toward the Fibonacci targets (11.921 – 13.771 USD).
Bearish Scenario
Losing the 0.618 support and the bottom of the range will lead to a decline to the zone (1.715 – 1.940 USD).
5. Conclusion
NEAR is currently at a critical level that may soon lead to significant price movements. By employing a step-by-step entry strategy and proper risk management, one can take advantage of this opportunity. Continuously monitoring trading volume and price behavior near resistance and support levels is key to success in this market. ✨
Always compare your analysis with other reliable sources and follow sound capital management principles. 🚀

NEAR/USDT Trade Setup. NEAR/USDT Trade Setup
Entry Price: CMP and $4.05
Stop Loss (SL): $3.60
Targets:
$8.50
$12.00
$16.00
$20.00
Leverage: 5x to 10x
The chart shows a descending triangle breakout, a bullish reversal pattern, indicating significant upward momentum.
Price is currently above the breakout level, validating potential continuation toward higher targets.
Let me know if you’d like further assistance or adjustments!
DYOR. NFA

SPOT NEAR LONG 28.12.2024Pinning after containment of sales.
🎯Purpose:
6.007
‼️Risk per trade: 0.5-1% of the allocated funds for spot trading.
Thank you for follow and the reaction🚀.

NEAR Inverse Head and Shoulders ?NEAR as long as it hold above $4 (not closed under $4) i think its performing iHnS
But if we close under $4 i think its will create double top and bearish continuation

$NEAR - $USDTClear rejection at the low and a rather obvious bullish trend starting with buyers having more momentum than sellers

NEAR: Technical Analysis | Bullish Momentum BINANCE:NEARUSD | NEAR: After retracing at 78.60% Fib level it has closed above 61.80% Fib level. Pitchfork is also acting really well as a support and resistance levels. If NEAR closes above 50% Fib level and Daily Anchored VWAP ($6.034) it has high probability to reach $9 target.

$SOL - $USDTThere's a clear bullish flag pattern with a clear trend and a breakout to the upside. Waiting for a retracement to the downside of the pattern before final movement indicated TP area. Partials would be taken out at TP 1 too

NEAR/USDT Potential 50% ++NEAR/USDT Potential 50% ++
Accumulate under $5.8 - $4.9
Short term Targets Points
TP 1 : $7
TP 2 : $7.6
TP 3 : $8
TP 4 : $8.5
TP 5 : $8.8

NEAR long entryhello to everybody and welcome back to another analysis with me, I hope you are all doing well.
in this analysis, we are gonna take a long position on NEAR.
after dumping for days, the price finally gave us a structure shift in the higher time frame and after pulling back for a day, the pullback phase is potentially over because we got a change of character in the lower time frame and it potentially means that the price is ready to go higher and take out the high that I targeted and make a higher high in 1h TF (hopefully).
remember to manage your risk and we all trade by probability, not certainty.
this is not financial advice and is my personal trades and opinions on the market so keep that in mind.
thanks for reading and have a great day. <3

NEAR Will Rug AgainMid timeframe NEAR create like HnS
This is super warning about this pattern like massive downside with the target is same with heigh of head
But HnS will happen if support break

NEARUSDTNEAR Protocols is in strong bullish trend.
As the market is consistently printing new HHs and HLs.
currently the market is retracing a bit after last HH, which is also the 50% Fib retracement level and local support as well. if the market successfully sustain this buying confluence the next leg up could go for new HH.
What you guys think of this idea?

NEAR - Primed for Action: Long Setup to $6 NEAR experienced a strong bounce after a significant sell off. The price has now retraced into the golden pocket zone (0.618–0.666 Fibonacci retracement) and appears to be accumulating within this range atm.
Key Observations and Trade Setups:
Accumulation at Golden Pocket:
The formation of a trading range in this area indicates that buyers are stepping in.
Once volume begins to pick up, it could signal the start of an upward move.
Upside Target:
Using the Trend-Based Fibonacci Extension, we project a 1:1 target around $6, which coincides with a key resistance level and another golden pocket zone.
This provides a potential gain of +22% for the long trade over the coming days.
Short Opportunity at Resistance:
The $6 level represents a strong confluence of Fibonacci and resistance, offering an excellent shorting opportunity if the price gets rejected there.
Trade Plan:
Long Setup:
Entry: Current accumulation zone around $5, also a key level to watch
Target: $6 for a possible +22% gain
Stop Loss: Below $4.50
Short Setup:
Entry: Around $6, once rejection is confirmed
Target: Depending on confirmation, potentially back to the golden pocket zone

NEARON weekly timeframe, near protocol broke the demand floor ,we want to see a confirmation of the weekly candle close below the demand floor ,its possible that selling will continue into area of strong demand for buy liquidity with hope to retest the broken weekly demand floor .on technical a broken demand floor is a supply roof ,where we will target 2.3-2.7 demand floor for potential upswing.

NEAR reversal areaNear is in a perfect level to bounce. Market is in extreme fear but this might be a good level to add on to holdings. Its both a good level of support from past price actions and current fibo levels.
Initial target is marked on the chart, lets see if we get rekt again :) Risk reward ratio looks good to me.
Cheers

NEAR Potentioanl longso we have another potential trade tonight and it's NEAR.
the price is strongly bullish as shown in the chart an we are currently in our range between those green dots and we can go higher(potentially).
if the price wants to go higher it must and has to respect the low that I circled around it and if not I will simply break it we then get a change of character.
if we break the lower time frame structure (shown with the green line titled CHoCH) we can say the price potentially can go higher(because we have all those liquidties above that are ready to be swept and the price has a reason to go higher) and gathered enough liquidity.
this trade is very risky because it can easily go the opposite way and become bearish so bear that in mind.
I will personally open a position as soon we gt that lower time frame confirmation.
this is not financial advice and simply an analysis.
thx for reading and have a great night or day <3

H4 CLS withing D1 CLS, HTF Order block, Model 1H4 CLS within D1 CLS, HTF Order block, Model 1
you are welcome to comment with your thoughts and share your charts or questions below, I like any constructive discussion.
What is CLS?
This company is trading for the biggest investment banks and central banks. They trade over 6.5 trillion daily volume. They are smart money of the all markets.
CLS operates in the specific times which will give you huge advantage and precisions to you entries. Focus on that. Its accuracy is amazing.
Good luck and I hope this educational post helps to become better trader
“Adapt what is useful, reject what is useless, and add what is specifically your own.”
Dave FX Hunter ⚔

$NEAR long all the information on the Chart . please respect to Capital managment and do trade safely . stop loss is 2%
