NEIROETH Breakout Loading!$NEIROETH is currently consolidating within a symmetrical triangle pattern on the daily chart, suggesting a potential breakout in either direction. The price action has respected this pattern for several weeks, gradually forming higher lows and lower highs. Notably, both the 100 EMA and 200 EMA are acting as dynamic support, reinforcing the bullish structure. A confirmed breakout above the upper trendline could open the door for a strong move toward the $0.21 level, offering significant upside potential.
NEIROETHUSDT trade ideas

Neiroeth ShortEntry 1 only if it retest the zone ill prefer entry 2
Enter only if bearish momentum formed.
DYOR

Neiroethusdt.p ShortI will short this coin if it goes to my marked zone ( manipulated zone ) and shows some bearish momentum i am going to enter in this trade.
DYOR
every thing is mentioned on chart

NEIROETH PERPETUAL TRADE ,Sold From $0.08180NEIROETH PERPETUAL TRADE
NEIROETH SELL SETUP
Currently $0.08180
Sold From $0.08180
(Trading plan If NEIROETH go up to $0.08600
will add more shorts)
Expecting target $0.07920 OR DOWN
Incase of early exist will update this anaylsis
Its not a Financial advice

NEIROETH/USDTKey Level Zone: 0.07450 - 0.07520
HMT v8.1 detected. The setup looks promising, supported by a previous upward/downward trend with increasing volume and momentum, presenting an excellent reward-to-risk opportunity.
HMT (High Momentum Trending):
HMT is based on trend, momentum, volume, and market structure across multiple timeframes. It highlights setups with strong potential for upward movement and higher rewards.
Whenever I spot a signal for my own trading, I’ll share it. Please note that conducting a comprehensive analysis on a single timeframe chart can be quite challenging and sometimes confusing. I appreciate your understanding of the effort involved.
Important Note :
Role of Key Levels:
- These zones are critical for analyzing price trends. If the key level zone holds, the price may continue trending in the expected direction. However, momentum may increase or decrease based on subsequent patterns.
- Breakouts: If the key level zone breaks, it signals a stop-out. For reversal traders, this presents an opportunity to consider switching direction, as the price often retests these zones, which may act as strong support-turned-resistance (or vice versa).
My Trading Rules
Risk Management
- Maximum risk per trade: 2.5%.
- Leverage: 5x.
Exit Strategy
Profit-Taking:
- Sell at least 70% on the 3rd wave up (LTF Wave 5).
- Typically, sell 50% during a high-volume spike.
- Adjust stop-loss to breakeven once the trade achieves a 1.5:1 reward-to-risk ratio.
- If the market shows signs of losing momentum or divergence, ill will exit at breakeven.
The market is highly dynamic and constantly changing. HMT signals and target profit (TP) levels are based on the current price and movement, but market conditions can shift instantly, so it is crucial to remain adaptable and follow the market's movement.
If you find this signal/analysis meaningful, kindly like and share it.
Thank you for your support~
Sharing this with love!
HMT v2.0:
- Major update to the Momentum indicator
- Reduced false signals from inaccurate momentum detection
- New screener with improved accuracy and fewer signals
HMT v3.0:
- Added liquidity factor to enhance trend continuation
- Improved potential for momentum-based plays
- Increased winning probability by reducing entries during peaks
HMT v3.1:
- Enhanced entry confirmation for improved reward-to-risk ratios
HMT v4.0:
- Incorporated buying and selling pressure in lower timeframes to enhance the probability of trending moves while optimizing entry timing and scaling
HMT v4.1:
- Enhanced take-profit (TP) target by incorporating market structure analysis
HMT v5 :
Date: 23/01/2025
- Refined wave analysis for trending conditions
- Incorporated lower timeframe (LTF) momentum to strengthen trend reliability
- Re-aligned and re-balanced entry conditions for improved accuracy
HMT v6 :
Date : 15/02/2025
- Integrated strong accumulation activity into in-depth wave analysis
HMT v7 :
Date : 20/03/2025
- Refined wave analysis along with accumulation and market sentiment
HMT v8 :
Date : 16/04/2025
- Fully restructured strategy logic
HMT v8.1 :
Date : 18/04/2025
- Refined Take Profit (TP) logic to be more conservative for improved win consistency

NEIROETH Trade Setup🚀 NEIROETH Breakout Watch
NEIROETH is on the verge of breaking out from its key resistance zone. The 50 EMA (blue line) is acting as solid support, and once the breakout is confirmed, we could potentially see a 40%–50% rally 📈.
📌 Strategy:
~ Entry: $0.078 to CMP
~ Stop Loss: $0.074 🛡️
~ Leverage: 5x – 10x ⚙️
~ Targets:
→ $0.098 🎯
→ $0.103
→ $0.110
→ $0.120 🚀
🔍 Note: Always DYOR (Do Your Own Research) and manage your risk wisely.
Regards,
Dexter

NEIROETHUSDT – Breakout AlertIn our previous analysis we spotted this symmetrical triangle but it eventually break down. After multiple rejections at the trendline resistance, price action formed a symmetrical triangle, leading to a bearish breakdown. However, momentum has shifted, and the market is now attempting a breakout from the key resistance zone.
Breakout Confirmed? If price holds above this zone, we anticipate a strong rally towards $0.08360, with an extended target of $0.19784.
Rejection Risk? Failure to hold could lead to a retest of the lower support at $0.01947.
Patience is key, let’s see how price reacts!

Bullish Flag pattern on NEIROETHUSDT forming on 12h time frameNEIRO/ETH is currently showing signs of a classic Bullish Flag pattern on the 12-hour timeframe, suggesting the potential for a continuation of the uptrend.
🔹 Pattern: Bullish Flag
🔹 Timeframe: 12H
🔹 Structure: Strong impulse move followed by a tight, downward-sloping consolidation channel
🔹 Breakout Potential: A breakout above the flag resistance could ignite the next bullish leg.
🎯 Trade Setup:
Entry: On confirmed breakout above flag resistance
Stop Loss: Around 0.06200 – below the flag’s support and key local structure
Take Profits: Based on the Fibonacci Extension levels from the previous impulse:
0.382 – First conservative target
0.618 – Mid-term target
1.000 – Full measured move of the flagpole
⚠️ Risk Management:
Always confirm the breakout with volume and candle structure before entering. Keep risk exposure within safe limits and consider scaling out profits at key Fibonacci levels.

NEIROETH/USDT – Double Bottom Breakout Targeting Higher LevelsHello guys!
Did you buy and hold it?
Let's see if there is another area to buy it or not!
NEIROETH/USDT has formed a double bottom pattern, leading to a sharp 357% rally. The breakout signals a strong bullish reversal, with a target around $0.10232. There’s a possible retest zone at $0.03600–$0.04200 where buyers might step in again. The RSI shows overbought conditions, suggesting a potential short-term pullback, but overall momentum remains bullish.
______________________
Key Points:
Pattern: Double Bottom
Immediate Support: $0.03600–$0.04200 (retest zone)
Pattern Target: $0.10232
Momentum: Strong bullish with overbought RSI warning
Risk: Watch for possible pullbacks but overall trend favors bulls.

NEIRO/USDT – Breakout Zone Approaching!!Join our community and start your crypto journey today for:
In-depth market analysis
Accurate trade setups
Early access to trending altcoins
Life-changing profit potential
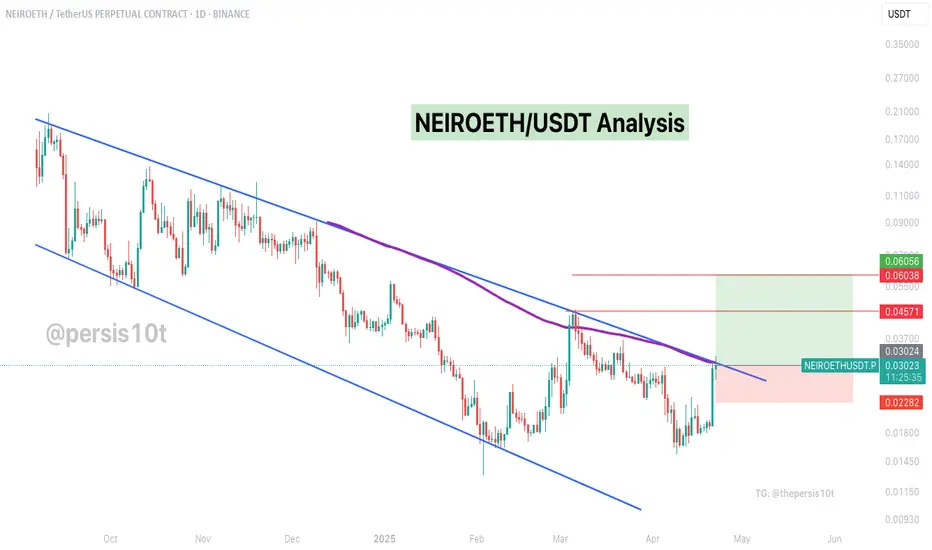
Let' analyse NEIROETHUSDT:
NEIRO is approaching a key resistance confluence — the downtrend line + 100MA on daily TF
Price is still below this zone, so no breakout confirmation yet, but it’s one to watch closely 👀
If this level flips with volume, we could see a clean move toward:
TP1: $0.0457
TP2: $0.0605
Invalid below: $0.0228
RR: ~3.5+
Breakout traders: wait for a daily close above $0.0324
Early entries can manage risk tightly under local lows
This is a high reward zone — patience is key !!
If you find this analysis helpful, please hit the like button to support my content! Share your thoughts in the comments, and feel free to request any specific chart analysis you’d like to see.
Happy Trading!!
NeiroETH — Strong Rebound Zone Hit. Big Move Loading?We just tapped into a major demand zone at 0.01532–0.01607, and the reaction was immediate — strong bounce straight off the level.
From here, I’m looking for at least a recovery into the mid-range of the descending channel, with potential for much more.
Main target — a breakout above the local ATH at 0.01993.
More thoughts in my profile @93balaclava
Personally I trade on a platform that offers low fees and strong execution. DM me if you're curious.

#NEIROETHUSDT maintains bearish momentum❗️Keep an eye on the BYBIT:NEIROETHUSDT.P — the structure suggests a possible local rebound or a breakout of the wedge to the upside. Opening a short here goes against the structure and lacks confirmation
📉 SHORT BYBIT:NEIROETHUSDT.P from $0.01612
🛡 Stop loss $0.01693
🕒 Timeframe: 1H
✅ Overview:
➡️ The chart shows BYBIT:NEIROETHUSDT.P forming a bearish continuation move after breaking out of a consolidation range.
➡️ Entry at $0.01612 corresponds to a retest of former support turned resistance.
➡️ Selling volume is increasing, supporting bearish pressure.
➡️ The POC level at $0.02084 remains far above the current price, highlighting downward imbalance.
🎯 TP Targets:
💎 TP 1: $0.01586
💎 TP 2: $0.01535
💎 TP 3: $0.01500
📢 Additional scenario notes:
📢 A false breakout above the entry zone is possible — wait for confirmation of the $0.01620 break.
📢 Watch for volume spikes near TP1 and TP2 — could signal partial take profits.
📢 If price reclaims $0.01693, the setup becomes invalid.
🚀 BYBIT:NEIROETHUSDT.P maintains bearish momentum — downside move expected!

NEIROETH ANALYSIS (12H)It appears that the NEIROETH diametric pattern started from the point where we placed the green arrow on the chart and completed at the point where we placed the red arrow.
Since the bullish pattern has ended and the price is below the descending trendline, sell/short opportunities can be considered in the supply zones.
The target could be the green zone.
Closing a daily candle above the invalidation level will invalidate this analysis.
For risk management, please don't forget stop loss and capital management
When we reach the first target, save some profit and then change the stop to entry
Comment if you have any questions
Thank You

NEIROETH Looks Bullish (4H)The correction of NEIROETH started from the point where we placed the red arrow on the chart.
This correction appears to be a diametric pattern, and we are currently in wave f.
Wave g could complete in the green zone, leading to the start of a bullish wave.
The closure of a daily candle below the invalidation level will invalidate this analysis.
For risk management, please don't forget stop loss and capital management
When we reach the first target, save some profit and then change the stop to entry
Comment if you have any questions
Thank You

neiro on eth is ready for an uptrend. dont fade70% to 100% increase is loading, thereafter, an aggressive move toweards 0.24 area

NEIROETHUSDTHi.
after 60% grow, we need to calm down... so use the oportunity
order blocks in lower zones must fill then we will continue

NeiroETHUSDT: Symmetrical Triangle Breakout WatchNeiroETHUSDT is currently trading within a potential symmetrical triangle formation. Our immediate focus is on the supply zone, which is expected to push the price down towards the buy-back zone.
If the price manages to break above this supply zone, we will look to initiate buying on a pullback, aiming towards the upper trendline of the pattern. Target areas have been highlighted on the chart for better clarity.
We welcome your insights on this coin, so feel free to share your view with us.

Neiroeth Bullish MomentumNeiroeth change of character of bullish momentum.
**Bullish momentum** refers to the upward force or trend in the price of a financial asset, indicating strong buying activity and the potential for continued price increases. It is often observed in stock markets, cryptocurrencies, commodities, and other trading instruments during periods when investor sentiment is positive or market conditions are favorable.
### Key Characteristics of Bullish Momentum:
1. **Higher Highs and Higher Lows**: Prices consistently make new highs while retracing to levels higher than previous lows.
2. **Increased Trading Volume**: High volume often accompanies bullish momentum, signaling widespread investor interest and confidence.
3. **Strong Technical Indicators**:
- Moving averages (e.g., 50-day moving average crossing above the 200-day moving average, known as a "golden cross").
- Relative Strength Index (RSI) above 50 but not overbought.
- Positive MACD (Moving Average Convergence Divergence) crossover.
4. **Positive News or Sentiment**: Favorable economic data, strong earnings reports, or optimistic market forecasts can amplify bullish momentum.
5. **Breakouts**: Prices breaking through resistance levels often confirm strong upward momentum.
### How to Trade Bullish Momentum:
- **Trend Following**: Enter positions in the direction of the trend, often on pullbacks to support levels.
- **Use of Stop-Loss**: Protect gains by placing stop-loss orders slightly below recent support levels.
- **Scaling In**: Add to positions incrementally as the trend continues, while monitoring for potential reversals.
### Risks to Watch:
- **Overbought Conditions**: Prolonged bullish momentum can lead to overbought indicators, increasing the risk of a pullback or reversal.
- **External Factors**: Unexpected news or geopolitical events can disrupt momentum.
- **Market Cycles**: Understand the broader market or asset cycle, as momentum often reverses with changing fundamentals.

NEIROETH superbWe had good Buy and Fbuy prints and straight 20% upside. With BTC on the launch mode, the rally of alt coins will be well caught by 7-star indicator.
Now we are in pullback as we have received a sell print.
DYOR
For early entries and indicator access, drop a message

neiroLet the green lines come, make decisions based on market conditions, because if they want to correct well, the blue lines will become more attractive.

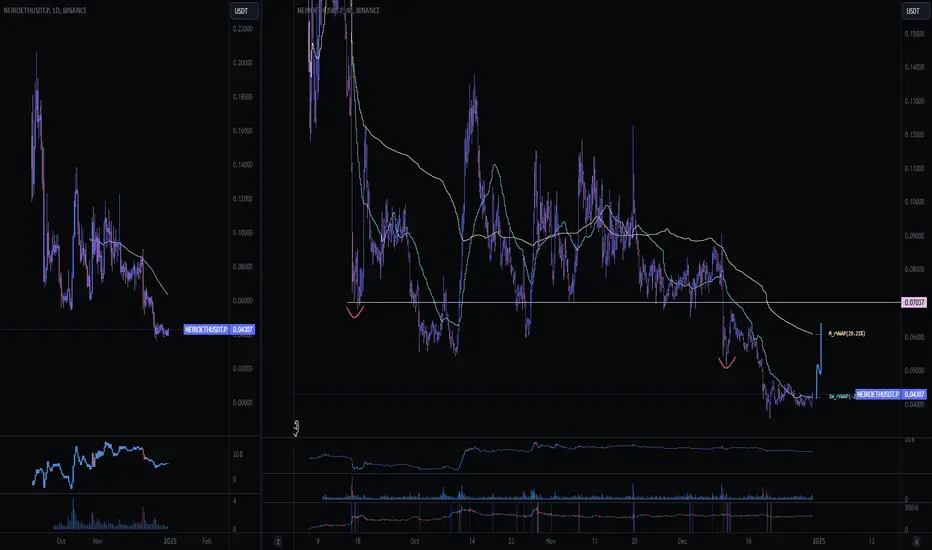
$NEIROETH - Scalp Long SetupOver the past week, NEIROETH has experienced a significant drop of about -83% decrease over the month.
NEIROETH appears to be at a level where we could see a potential bounce.
If we can hold .040 (weekly_rvwap) , there's a chance we retest the nearest swing point at .052 or even tag (m_rvwap) at .060
We can long at current market price and leave something for DCA if we dip around .040 to .038 area
Setting stoploss below the low at .035
Targets:
.052 (swing point)
.060 (m_rvwap)
.72
Long NEIROTimeframe: 4H
Entry Zone: The market has traded below a key low (marked in the 4H chart) around 0.05420. After a significant downward movement, price has shown signs of consolidation and potential reversal, signaling an opportunity for a long entry near this support area.
Target: Targeting a significant level at 0.0680 on the 8H chart, where we expect the price to face resistance (highlighted with a blue box). This provides a risk-to-reward ratio of approximately 2,3 to 1
Stop Loss: Place a stop loss just below the recent low at 0.0430 (or slightly below this area to allow for minor fluctuations).
Trade Rationale: Price has shown significant bullish momentum after the key low, and there is strong support at 0.03218.
We are looking to capitalize on the potential bullish breakout, with a high-probability reversal setup based on the current market structure.

Neiro on Ethereum NeiroETHNeiroETH have been dumping all this time, I think now it should start Pumping
