CIBC Risk Adversity*Not Trading Advice. (of course)
Historically CIBC has not performed well along this Fibonacci Channel.
While it could be years before the stock returns to the lower trend, it would appear that there is significant risk with little reward in buying in this area.
CM trade ideas

A signal so bullish it might make you $CMKey Stats
P/E Ratio: 12.86 (below the sector average of 11.8)
Dividend Yield: 3.89%, with consistent payout history
Next Earnings Date: Feb 27, 2025
Recent Upgrade: Barclays raised target to $98 (Nov 30, 2024)
Revenue Growth: 7% YoY
Top 3 Technical Reasons for Bullish Bias
Breakout Zone Approaching: Price testing $94, a critical resistance from August. Break here unlocks $100+.
Golden Crossover Incoming: The 50-day SMA is edging toward a crossover with the 200-day SMA—classic bullish signal.
Strong RSI Rebound: RSI at 58, climbing but not yet overbought, suggesting more room to run.
Top 3 Fundamental Reasons for Bullish Bias
Undervalued vs Peers: Low P/E and price-to-book ratio make CM a bargain in the Canadian banking sector.
Dividends Make It Rain: 3.89% yield at this valuation is a fortress for income investors, even if growth slows.
Economic Recovery Boost: Canada's improving GDP and housing markets directly benefit CM’s retail and mortgage banking units.
Potential Paths to Profit
1️⃣ Lowest Risk: Buy shares outright and collect that juicy dibadend while waiting for the move to $101.
2️⃣ Options Play: Buy LEAPs.
Disclaimer: We are not a brokerage or investment firm. We do not offer financial advice or investment advice and/or signals. This is not certified financial education. We offer access to the daily thought process of an individual and his experiences. We do not offer refunds. All sales are final.

Chartvzn Analysis: Canadian Imperial Bank of Commerce (CM)b]Key Stats
Market Cap: CAD 55.6B
P/E Ratio: 12.89 (Moderately undervalued compared to industry averages)
Dividend Yield: 5.91% (Solid for income investors)
Revenue Growth: 2.58% YoY (Recent FY revenue: CAD 21.31B)
Next Earnings Date: December 7, 2024
Technical Reasons for Upside
Bullish Hammer Formation: Recent price action carved out a hammer candlestick on November 20, signaling strong buyer support at lower levels.
Ascending Channel Support: The stock is hugging the bottom of a long-term bullish channel, offering an attractive risk-reward entry.
Oversold RSI Recovery: Daily RSI bounced from oversold levels (38), aligning with potential upward momentum.
Fundamental Reasons for Upside
Strong Dividend Play: A consistent 5.91% yield positions CM as a defensive pick amid market volatility, attracting income investors.
Positive Analyst Sentiment: Recent upgrades, with price targets ranging from CAD 94 to CAD 97, signal optimism in CM’s performance.
Improved Loan Portfolio Risk: Management’s risk transfer initiatives are reducing exposure to corporate defaults.
Potential Paths to Profit
Low Risk: Accumulate shares below CAD 93. Enjoy the dividends and hold until the target is hit.
Options Play: Buy Dec 20, 2024 CAD 94 calls (~CAD 2.10 premium). Attractive theta decay under low volatility.
Pair Trade: Hedge with short positions in a weaker Canadian bank like Laurentian (LB).
Disclaimer: We are not a brokerage or investment firm. We do not offer financial advice or investment advice and/or signals. This is not certified financial education. We offer access to the daily thought process of an individual and his experiences. We do not offer refunds. All sales are final.

High Probability Short Trade on CM with 1:5 Risk to Reward RatioHuge liquidity available above ATH 84. Price may sweep the liquidity above and reverse down and fill the fair value gaps. Strict stop loss should be executed if the 30 minute candle closes above 86. Target 1 - 78.5. Target 2- 73.
I would even suggest buying a DEC 20 CM 80PUT @ maximum of 1.4
PS. Use pyramiding for best result

LT Support Area / 200-500 Channel DailyA bunch of support here and stochastics look good on all timeframes presently. A move above 43.50 puts it into a 200-500 moving channel. Next resistance is the 44 figure. 47.50 first target and then 49.40-51.50. Stop would be daily close below 41.70 so RR is reasonable. Volume is currently light which is not fatal but also not ideal. With bank earnings now coming that may change.

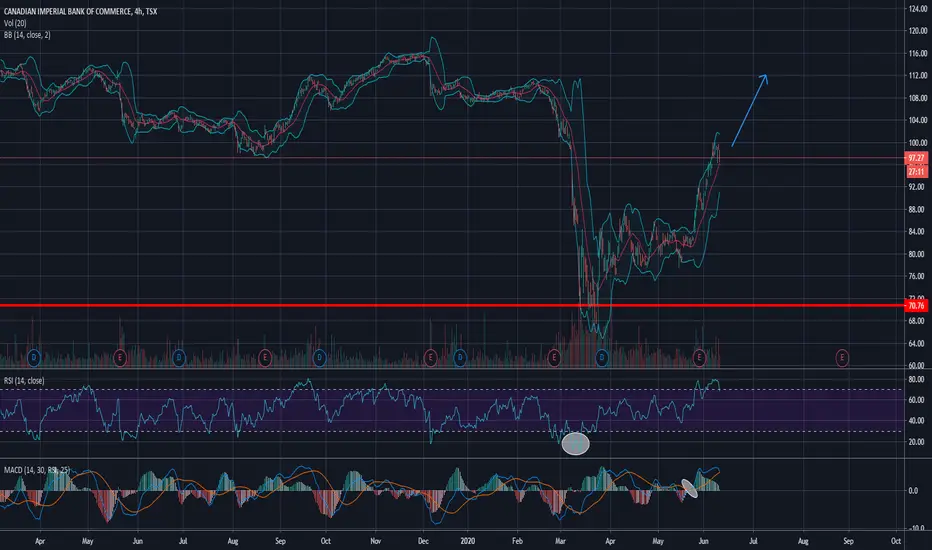
Pattern of the Year?I actually really like this chart. It literally has a simple pattern, buy the bottom envelope (green arrows) and sell the top envelope (red arrows). The biggest thing that sticks out to me is the volume (pink arrows). Before every bounce to the upside, there is always a HUGE volume spike. Will we see another move up following this same pattern?

$CM with a Bearish outlook following its earnings #Stocks The PEAD projected a Bearish outlook for $CM after a Negative Under reaction following its earnings release placing the stock in drift D with an expected accuracy of 71.43%.

CM - Double BottomsA large Up channel
Price right now is looking to push to the limit and hit the top of the up channel
Once this is hit price may be rejected and pushed back down to the bottom or out of the up channel
This will also be observed as a double bottom pattern , comparable to one seen earlier in prices evolution
Short term bullish

$CM with a Bullish outlook following its earnings #Stocks The PEAD projected a Bullish outlook for $CM after a Positive over reaction following its earnings release placing the stock in drift B with an expected accuracy of 37.5%.

Canadian Imperial Bank Canada Sun Storm Investment Trading Desk & NexGen Wealth Management Service Present's: SSITD & NexGen Portfolio of the Week Series
Focus: Worldwide
By Sun Storm Investment Research & NexGen Wealth Management Service
A Profit & Solutions Strategy & Research
Trading | Investment | Stocks | ETF | Mutual Funds | Crypto | Bonds | Options | Dividend | Futures |
USA | Canada | UK | Germany | France | Italy | Rest of Europe | Mexico | India
Disclaimer: Sun Storm Investment and NexGen are not registered financial advisors, so please do your own research before trading & investing anything. This is information is for only research purposes not for actual trading & investing decision.
#debadipb #profitsolutions

$CM - open with stopI would be in around $56.29. The vwap is crossing the 50 SMA - which is often a nice indicator for me.
I play calls on this one and scalp it with options to make money and get out.
It is right at resistance but with the vwap crossing - it is worth the risk for me. Tight stop.

$CM with a Bullish outlook following its earnings #Stocks The PEAD projected a Bullish outlook for $CM after a Positive Under reaction following its earnings release placing the stock in drift A with an expected accuracy of 66.67%.

CM Evening StarNYSE:CM
Double Top
Evening Star on 20 and 50 EMAs
MACD reset and reaccelerating down
Bottom trendline breaking

CM - Short/Put PlayCM is at an all-time high.
A good PUT entry position would be close to $115
BlueWave is giving Red Dot sell signals + A Bearish Divergence
Stochastic RSI is OverBought
78% Fib Level acting as a potential Resistance level

CANADIAN IMPERIAL BANK OF COMMEERCE Strategy Hello traders, CANADIAN IMPERIAL BANK OF COMMEERCE is in a bullish configartion with a hammer candle and high volume buy executed. On the TIMEFRAME M1 we see a dragon doji with a strong continuation of the volume of purchases made, it goes towards the top of the stabilization zone to retest it. Strong potential to breakout the price with the momentum of both the zone to join the second and land on the next high.
With a bearish breaking gap to fill (seen from TIMEFRAME H4), to access the next high followed by a test from the top of a stabilization zone in the future. See how the top of the bullish channel reacts in this session.
Please LIKE & FOLLOW, thank you!


weekly analysis CANADIAN IMPERIAL BANK Hi friends
the weekly analysis of this market shows that we must wait for the breakout of resistance at the level 108.36 after positioning ourselves as much as the buyer the next objective is 107.22

$CM with a bullish outlook following earningsThe PEAD projected a bullish outlook following a positive under reaction for $CM placing the stock in Drift A
If you would like to see the Drift for another stock please message us. Also click on the Like Button if this was useful and follow us or join us.


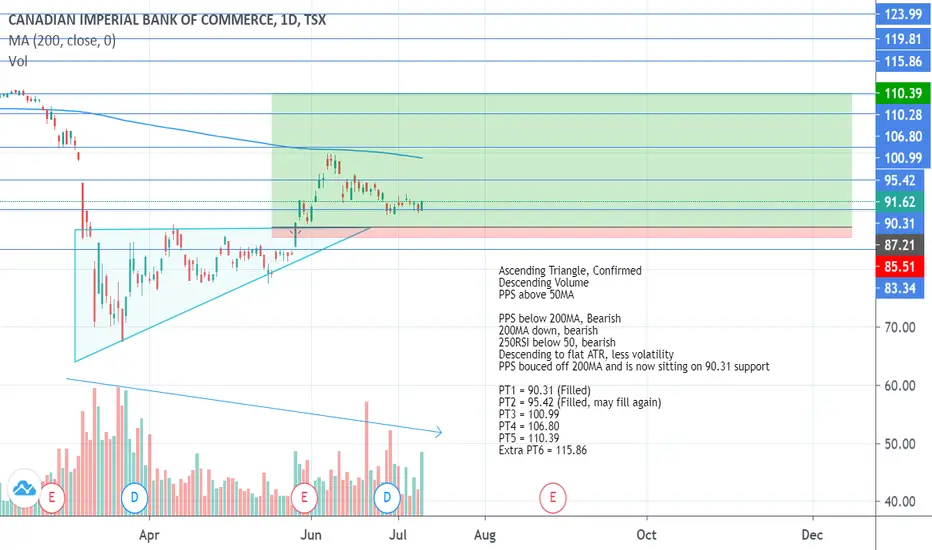
CM: Ascending Triangle, ConfirmedAscending Triangle, Confirmed
Descending Volume
PPS above 50MA
PPS below 200MA, Bearish
200MA down, bearish
250RSI below 50, bearish
Descending to flat ATR, less volatility
PPS bouced off 200MA and is now sitting on 90.31 support
PT1 = 90.31 (Filled)
PT2 = 95.42 (Filled, may fill again)
PT3 = 100.99
PT4 = 106.80
PT5 = 110.39
Extra PT6 = 115.86
Canadian Banks cover the gap and fail at resistance.....All Canadian banks show similar patterns. Downtrend over the last 2+ years. Broke support to the downside last March leaving a decent size gap. Bounce over the last few weeks to cover the gap and fail at previous support, now resistance. going down imo.