CM trade ideas

More To Go?I like CIBC at today's price but there may be more to come.
Canadian banks are some of the most conservative and solid in the world which is why we already own some of this one. But, the monthly chart suggests that if another down-leg starts, this one may see prices in the low 70's.
Who the hell really knows. At the current price as I write this of $87.50, the stock has a yield of 6.83% They have not missed a dividend since 1868! Payout ratio is 50.62% - in line with it's average or the last 5 years. So I like it.
The risk right now would be that the insanity over this virus keeps people in their homes for a while - like Italy that just shut down the entire country. apnews.com The premier has asked all 60 million inhabitants to stay home. That would cause more than a few missed mortgage payments. If the same happened here, this would naturally be a bad thing for a bank stock. A big hit in earnings could see the dividend cut in half maybe - still a heck of a lot better than a GIC or bonds with a 30% + gain potential for the current price just to recover to November 2019 highs.
In the long run, this will run it's course and things will recover. I don't think we are going all Mad Max. We own some but I also have a an open order with a limit at $72.50 because I am a greedy bugger (and a little paranoid)


CIBC at it's limit for now?After a good run TSX:CM is up around 12% from the time of writing since the last chart was put out. (Link at bottom)
As there is plenty of resistance around this level i think it's best to sell.
I think we could see a very deep retrace from here, so I'll be watching to re-buy around $100 if I can!
Keep watching for bullish price action below, and don't get greedy!
Overall i consider this stock a really good pick! Definitely a keeper, with a great dividend.
Not expecting it to break lower trendline.
Previous chart:
()


CIBC Trendline supportCIBC on trendline support.
Stoploss below trendline, with next support at $90, then $70.

ER Surprise W Short term flat to bullish surprise er, maintains current wedge..break points 99.51-101.50 Trend Line watch.


CIBC | 40% Short Trade SetupConfirmation: 99.65 (weekly candle)
Invalidation: Local high
Type of Trade: Countercyclical (EMA50 above EMA200)
Target: 56.46
TF: Weekly
Leverage: 2x
Pattern: 1) monthly rising wedge reversal with 2) break of weekly support, and 3) break of major support line.
Monthly view:


CM short (Canadian Banking sector)Time to look for an entry here, best seems Canadian Imperial Bank of Commerce.
Maybe it is better to wait for a small bounce and enter then/

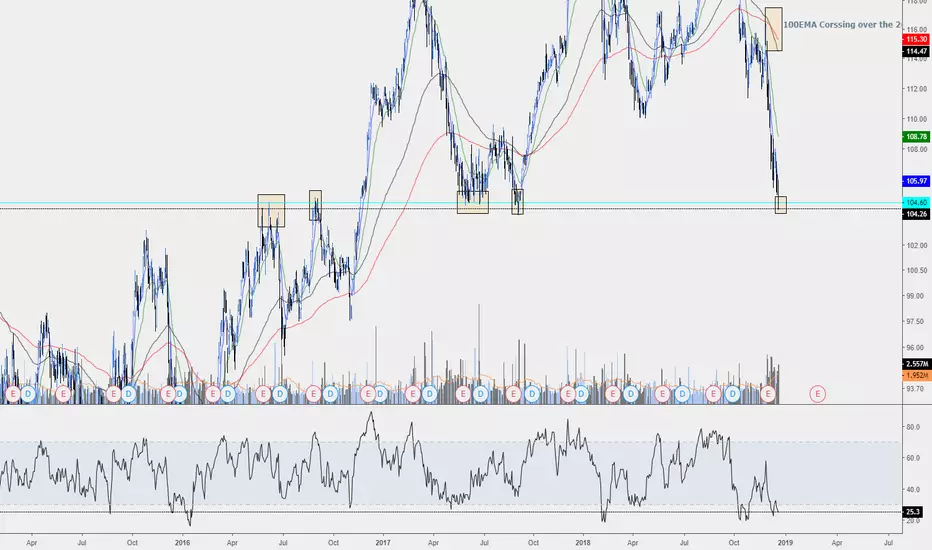
CIBC Hitting Major Daily S/R LevelTaking a look at the daily chart CIBC TSX:CM to see that it could be at a very decisive point around the $104 area. Price hit a major horizontal that acted as a strong resistance turned strong support with price hitting that level on multiple occasions with subsequently massive price movement to follow.
* If price breaks this S/R level with conviction I will look to enter on a pullback to the S/R level
* If price bounces off this level this week I would cautiously enter a long position with a stop just below the S/R level
Considering the current market conditions and with this being the third retest of the S/R Level coupled with the 100EMA/200EMA bearish cross I'm inclined to favour the bearish scenario over the bullish in this case.
Trade Wisely,
Chloster
CIBC - Short Term Bear, Long Term BullThe overall market correction is pulling everything down - at least for the short term (1-4 weeks), but for CIBC the fundamentals bulls will line up with the technical bulls around May 17th. Depending on Market conditions this could be a major swing for CIBC. Notes on technical analysis are in the chart.
I try to keep my charts clean and use only common, frequently used indicators to align with overall technical analysis sentiment.

Bank vs. Cryptocurrency #13 (CM)This stock is lagging compared with others in the Financial Industry and compared with past examples of this series of publications
I say this based in the highs of 2007 before the drop in 2008 because others leaders in this industry already surpassed the highs of 2007
Others are between the 2007 and 2008 highs but not above
And other very lagging are below the 2007 highs
Now in 2018 there are resistance in front of the price close to 100.00 and in the 105.00 area, more resistance
2007 Highs, 105.00 price area = Resistance
That tells me not to buy in resistance, but there is a but and is my discretion because I use a manual system for pick stocks and not mechanical trading system
What does this all mean
This means I have thoughts = I use a discretionary process for picking stocks
And I bet for a resistance breakout based in that leading banks in this sector are more ahead in the price action scene
In other words there are leading companies and lagging companies in a Industry/Sector
I follow 168 listed companies in the Financial Industry
I can appreciate the leading and the lagging and select the lagging because he is following the leaders

CIBC Breaks out on earnings but faces a big resistance testCM shares have broken out of a $112 to $115.50 trading range and rallied toward $118.00 after EPS came in way above street. They still face resistance between the $120 round number and $120.80 where they peaked in a double top earlier this year. With other Canadian banks faltering short of their 52-week highs even though the shares have the wind at their back today, further upside could be limited in the near term.

CM - coiled stochastic breakout + divergence in progressCM - coiled stochastic breakout + divergence in progress. Target = $83.10

CM Evening Star ReversalFriday formed the 2/3 leg of the evening star reversal pattern w/ 4.2x's normal volume. Will be short if price breaks below 81.19.

