GOLD trade ideas
GLDG Q1-Q2 Breakout and Macro AlignmentWith the current meltup in the market due to the Trump Pump and seemingly good data all insiders know that the market is overvalued and running on fumes. This exuberance and recent turn up for risk on assets, however, has caused a pullback in gold. Add to that historical post election bull run lasting approximately 90 days, timing exactly to moment of inauguration, it stands to reason that there will be a market correction in Q1 2025, causing Gold to further spike up. Combine that with the technical profile of a gold miner like GLDG and it stands to reason that Q1-Q2 2025 GLDG will run up very quickly, likely reaching 2-3x.
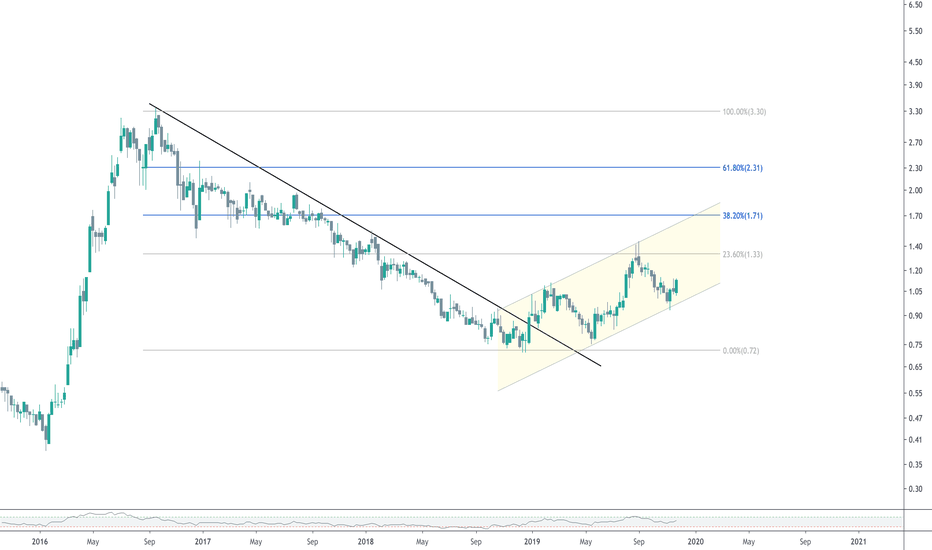
GLDG 4 Year Falling Wedge, Cup Handle breakout w/ Diamond Bottom
Looking at the Monthly Chart, the falling wedge pattern becomes clear, with clean break and possible cup & handle in play.
The diamond bottom on the 4 hour is shaping up nicely. Look for a break out sometime later this year.
The bands are beginning to twist on the 4 hour, daily, and monthly. Weekly still has upward momentum.
Above the 200, trying to confirm the 200 support and it will be off to the races.
Price Target: $2 - 2:50, could go as high as $3.50
My Swing Gold Play Before BRICSTLDR: I'm bullish on GLDG and going long for a swing. Entered twice since last month to build a position before the BRICS summit later in August.
I've been following and studying gold for the past few months, and I like Goldmining Inc's (NYSE: AMEX:GLDG ) projects and vision for the industry. The company also recently had a successful Nasdaq IPO ( NASDAQ:USGO ).
There are a few reasons why I'm going for a long with GLDG:
- Gold (XAUUSD) is in a good position. 5% in the year, was ~13% at its highest, and 18% growth since 2022 lows.
- The BRICS summit on August 22nd-24th, there are talks in which the participating nations will discuss a new currency that the signed nations will use instead of the dollar, and that currency will be tied to the gold reserves.
- Banks and nations across the globe are announcing the purchase of more gold, loading more to expand their reserves in light of the increased need for diversification since 2022's market downtrends and inflation.
Also, GLDG's chart interests me. There's a downtrend since April 2023 that has met lower support that we already saw last year, and since then, there has been a test of higher levels.
I believe that the chart could play nicely and spike with more news coming from the BRICS summit later this month.
I entered on $0.90 on July 28th and $0.89 on August 11th. Stop at previous support ($0.85), which will be a ~3.75% loss in case the chart goes the other way if nothing happens on BRICS. Hoping to get at least 10% on a potential long exit.
GOLDMINING INC (GOLD) Ready for Next Rally? (+34% Potential)Hello fellow traders,
Today we are looking at the daily timeframe for GOLDMINING INC (GOLD) on the TSX. As we can see, GOLD peaked around $3.85. It has since corrected, printing a double bottom at previous resistance, in between the 50/100 EMAs (yellow/pink).
Prices have broken and are now trading above all EMAs. The RSI has increasing fast, and the MACD has just given off a bullish cross. Additionally, we have increased volume coming in with prices moving up. All of these signals are bullish. The key levels to watch here around $3.40 and $3.60, past which, prices can easily jump. On the chart, I have marked the three likely paths using arrows that prices should approximately follow. Depending on the level of resistance ahead, primarily at the $3.60 level, prices may either jump or correct back down and continue trading in this wedge.
A potential entry zone now would be $3.10-$3.35, with a second entry around $2.75-$3.00 if prices break down to the next support level. An immediate target would be at them most recent highs, around $3.80 (+14%). A breakout past the most recent high could launch prices up to the 1.618 Fibonacci level, at around $4.50 (+34%) in the short-to-mid term. A stop loss could be placed in the $2.50-$2.60 range to be safe, however I am not using one as of yet because my entry was at $2.94. Keep your eyes on this one!
Let me know your own thoughts and comments down below. Remember to leave a like if you enjoyed, and check out my profile for more stock and cryptocurrency trading ideas. Thanks for reading!
Price at writing: $3.24
consolidation nextI think the price will fluctuate between 3 and 4 cad dollars the next months. just boring consolidation at this point. when gold starts moving in about 2 months and finishes the year at 2100 this stock will go to 5-6 cad dollars. if gold cant manage to hold the supportline from march this stock will plunge down under 2 cad dollar. its about 60-40 in favor bull


