NEOBTC trade ideas

#NEO Hodling quite good ~174k sats support level on the way up..#NEO Hodling quite good ~174k sats support level on the way up...
Worth watching it for continuation..

NEO - Next Stop: The Moon!Get on the Neo Train before it leaves the station. Strong bullish continuation since August and the price has held up this entire dump. I think the price is ready to take off! I'm long here.

Bull flag on NEO!Hello, Traders!
ETH/BTC seems to be breaking out one Bull Flag,
Here is a strategy to bull flag buy. Our buy point is above this maximum accumulation, stop on second support on intraday timeframes.
On the chart, we mark important information as entry points, Stop Loss, and our objectives are bull flag projection
Please support this publication with your likes. You are welcome to follow us on the Tradingview.

NEO/BTCNEO has finally broken the 1-year accumulation zone. Such kind of breakout usually give a healthy pullback to the range before conitunation IMO.
Note: If you like the content and the setup, please give me a follow not to miss out on many altcoins charts to come.

Here I go long on NEO and NEO will go upHere I go long on NEO and NEO will go up. The price is testing the major resistance, so now I go 5x long and the bullish breakout will start And NEO rocket will launch.
whos gonna sell NEO now?
See you up there

NEO / BTC
Hello, dear! 🧡
Continue my hashtag #rocketbombquickidea for you🔥🔥
If you like such format of my quick analyzes, support idea with like. I'll try to find more opportunities for making 💰
Always in touch with you🧡
Sincerely Your Rocket Bomb🚀💣
PS Many alts just give wonderful profits.🔥🔥🔥
Results👇🏻👇🏻👇🏻


NEOBTC : SEND IT or BUSTNEO has still some room to go parabolic and hit our second TP at +50%. Sold my first bag at our first TP, still holding some.
4h/12h stoch has sitll some room, Im not worried yet.


NEO under Heavy Accumulation neer a pullback when BTC broke out unlike the rest of the alts/btc weekly big bull daily big bull. Time to be bull.

NEOBTC nice breakout from weekly resistance 🦐NEOBTC had nice breakout from weekly resistance, ( nice profit in Plancton Vip Channel ) and now the price is inside a channel.
The price could have a retracement to grab some liquidity, According to Plancton's strategy, we can set a nice order
–––––
Follow the Shrimp 🦐
Here is the Plancton0618 technical analysis, please comment below if you have any question.
The ENTRY in the market will be taken only if the condition of Plancton0618 strategy will trigger.


ALTSEASON SOON! (big caps)ALTSEASON will come soon, first all the small caps are pumping then will come the time for all the big caps
I will accumulate a few of fundamentally interesting ones
The criterias for investing in a big caps are the following :
1) active team with an active repository
2) the capacity of the fundamentals to hype the new investors
3) branding and parternships
4) dont fomo into pumped setups, buy in accumulations periods


Neo ready to pop - the longer NEO waits the larger the returnsNeo ready to pop - the longer NEO waits the larger the returns.
No one is talking about this which puzzles me but hey sometimes these pump happen for almost no reason.
Don't take my advice, I am just a painter who likes to pick colors and tell stories.
I picked 5 days or 5 bars as these run up when they really get going have lasted 5 days, it makes for a nice weekly candle close.
6 days would look sloppy and unorganized and who wants that in the crypto markets?
not me
but I get it anyway.
If individual projects are hard to pick then just invest in the entire market - I use the GDLC index fund - link below.
side note:
every year we have a darnling project cryto falls in love with - first bitcoin, then XRP and LTC then ETHE then NEO then EOS then a buch of DEFI and this year LINK.
Just look at the NEO chart to see how LINK will rise and fall eventually.
It is like looking into the future.

NeoBTC Broke out of Historic Resistance. Targeting 2500 SatsThis is an update of my previous analysis of NEOBTC.
As mentioned before, Eliot wave A and B was complete and Its going to target 1.618 Extension at 2500 Sats for wave C.
Daily MACD has a bullish crossover.
Resistance trendline is broken.
It took much longer than expected but pattern hasnt changed much and it broke out of sideway action.
Huge Gains incoming for NEO.
Fingers crossed.
Best of luck
Please like and subscribe

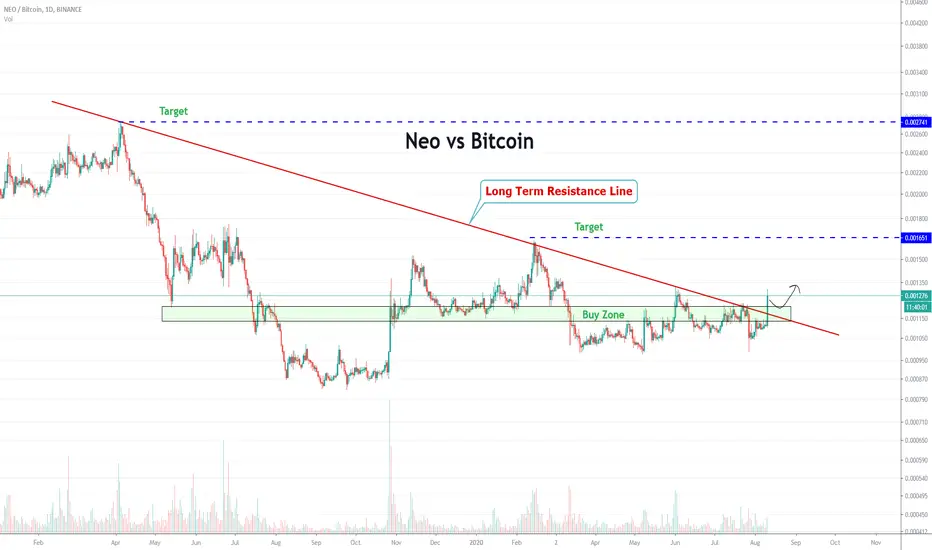
Neo Trading ideiaHello Traders,
Neo Broke out an important downtrend line and is indicating that is going to continue its upward movement. We would recommend to buy if it does a pullback to the support zone.
NEO ANALYSIS - LOOKING GOOD HERE....1W - 27 EMA SUPPORT
1D - EMA CROSS
1D - 200 EMA SWEEPING IN
BULLISH CONSOLIDATION UNDER RESISTANCE
RSI BULLISH
VOLUME INCREASING
Like and/or Comment.
Thanks


NEOBTCneobtc
downtrend weakness
(vol decrease in downtrend)
4h regular divergence ( trend reversal sign )
daily support @.000998

