NEO/BTC LONGHello guys,
I am thinking of opening long trading with 1-3 btc in NEO / BTC parity.
I hope that the price will come here around 1-2 months.
Sharing is not an investment advice.
I am trying myself.
NEOBTC trade ideas

Pull back -> reentry & ltf trend invalidationneo most probably bounce back from fib level 38 or it from 50 . slipped down 61 fib uptrend suspended in ltf


NEO woken up, aiming for my 4rd target nowHey guys welcome for a fresh crypto update, please like and follow to support us
--------------------------------------------------------
i published NEOBTC update in Oct 2019 and almost predicted the exact bottom
as of now NEO prices have grown by more than 90%
already my given two targets have been completed and now NEO is looking to aim for the 3rd and 4th target which i've predicted for long term
you can clearly see this in below chart
--------------------------------------------------------
now targets are still same so i wont waste your precious time, just be in the game...
Thanks for reading...
For the most profitable premium trading services DM me or contact me through twitter or telegram
--------------------------------------------------------
this is Husain Zabir, signing out
Thankyou...

NEO time to fly Info on the chart
inverted hammer out side of the 3D ichi cloud gonna make you drop that like ;)
NEO/Bitcoin Daily Technical Analysis in Fibonacci & Cup Charts NEO/Bitcoin Daily Technical Analysis in Fibonacci & Cup Charts .. .


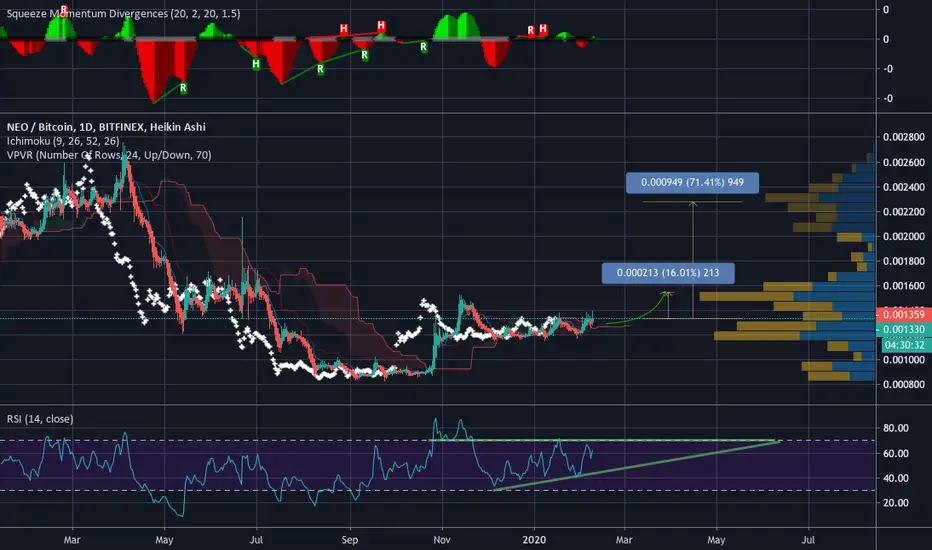
NEO - Inverse Head and Shoulders - 50% TargetNEO appears to have completed a negative leaning inverse head and shoulders pattern. Given the head height, I place the target at around .00022. I'm long here.


NEO - shorting finished ABC correctionNEO is very bullish, it has nice 5 wave uptrend, but now we are in boring correction, volume is good, but that´s only possitive, that I can say about this recent move to the upside. After we will go down towards 1100 satoshi, I will close my short and definitely go LONG. I am using binance margin for shorting.

NEOBTC ready to rise?Welcome fellow tradingviewers,
NEO/BTC is showing some real vital signs. With the mini-Altseason we have had the last couple of weeks NEO has been holding back. But now it might just be time to shine!
Monthly:
- We saw a beautiful bullish engulfing candle back in October, indicating more upside.
- The months after october have been slow indicating more upside.
Weekly:
- The last candle closed in a bullish engulfing cande, indicating more upside momentum.
- We are currently testing the 50MA, indicating downside momentum, unless we break it on the first try and find support.
- Weekly MACD crossed bullish, indicating more upside momentum.
- RSI neutral.
Daily:
- This daily candle is looking like a bullish engulfing, which upon close would indicating more upside momentum.
- Daily cup and handle can be found with the breakout level around 1500 sats.
- we are above all MA's and have used them as support, indicating more upside momentum.
- MACD crossed bullish, indicating more upside momentum.
- RSI is neutrals.
In summary:
The most important resistance to break right now would be the 1500 sats area. If this area breaks, the C&H pattern will be breaking out.
The C&H pattern has a target around 2100-2200 sats, if this C&H pattern is going to show us some real strentgh then we might be heading even higher towards the 2600 sats area, but this is too soon to say right now.
Let's focus on what is going to happen in the 1500 sats area first.
This analyses is only intended to share my idea, to educate and entertain you guys.
This should not be considered as financial advice.
I hope you guys enjoyed this analyses, if you did don't forget to leave a Like!
If you want to share your thoughts, please do so in the comments below!
Kind Regards,
FORALLCRYPTO


NEO LONG!Neos momentum is going up as well as money flow. should be a easy 2-3% gain! also all the MA look really good!

NEOBTCswing trading since 15 Nov 2019
been jumping since start of Feb 2020
its in a buy swing for long term.
good luck traders

NEO (Feb 2) 52% Potential Profit in 35 Days#NEO/BTC (Binance)
Buy : 1250 - 1300
Sell : 1350 - 1400 - 1500 - 1600 - 1700 - 1800 - 1900
Stop : 1125
#NEO $NEO #NEOBTC

NEO (Dec 04) 46% PProfit in 88 Days#NEO/BTC (Binance)
Entry Zone: 1150 - 1200
Take Profits: 1300 - 1400 - 1500 - 1600 - 1700
Stop Loss: 1090

neobtc longFinally neo completed the inverse head and shoulders pattern.
This is huge given that it's taken so long to form it, an invalidation would be hard at this point.
A breakout above the neckline would be inviting in terms of long position.
Just an idea, not a financial advice.
Check out my other analysis if you want.


Moon pattern, get ready for a big candleyes if the prices doesn't go down and it maintains like this at the end it will do a big candle


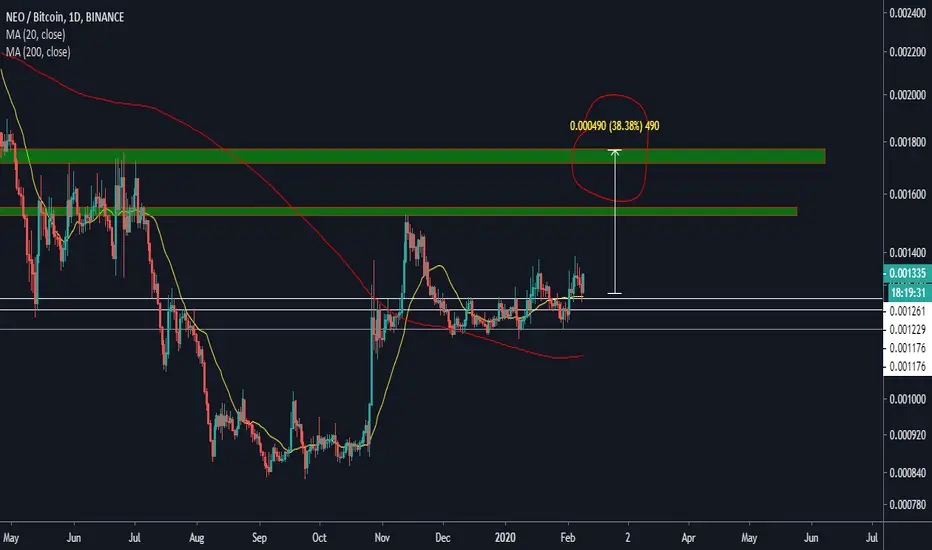
NEOBTC LONGNEO/BTC has insane potential.
Inverse head and shoulders pattern almost formed
Volume is decent.
If it breaks above 0.0014 then it's likely to explode upwards.
Check my other ideas and good luck with your trades.
Not a financial advice, just an idea
