NEOBTC Range Trading| Structural Resistance| Low Volume Hello Traders!
Welcome to another update, today’s chart will be on NEOBTC, currently trading range bound where a break bullish will put emphasis on a clear higher high and a probable trend change.
Points to consider,
- Range bound trading
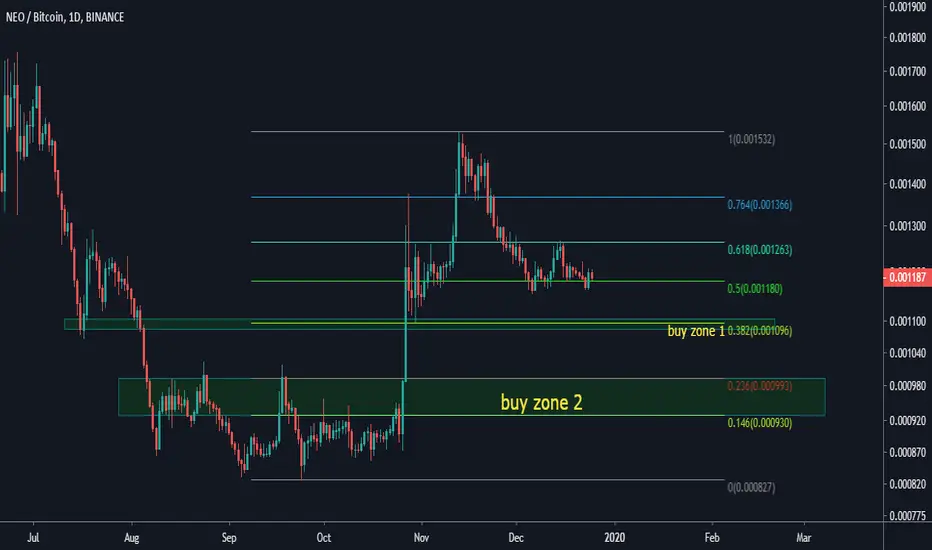
- .50 Fibonacci level – strong support
- Structural resistance being tested
- Stochastics in upper regions
- RSI respecting support
- Volume below average
NEOBTC is as of now attempting to break structural resistance which is in confluence with the .236 Fibonacci level, a break will put in a higher high in the immediate trend.
The .50 Fibonacci level is current support which has been tested multiple times, but to be backed with buy pressure coming in.
The stochastics is currently trading in the upper regions, can stay trading there for an extended period of time, however lots of stored momentum to the downside. RSI is respecting its local support (around 38), currently trading in neutral.
Volume is clearly below average, an influx is required to break key levels successfully otherwise fake outs are highly probable – evidently on fist attempt.
Overall, in my opinion, NEOBTC needs to break from its range bound trading, a break bullish will increase the probability of a macro trend change, and this is more likely as NEO is trading above key moving averages.
An important metric to monitor is volume, which is well below average, NEOBTC needs an influx for continued follow through.
What are your thoughts?
Please leave a like and comment,
And remember
“A quiet mind is able to hear intuition over fear.”
― Yvan Byeajee
NEOBTC trade ideas

NEOBTC formed bullish Cypher | A good long opportunityPrice actions of 19th laargest cryptocurrency NEO with Bitcoin coin pair has formed bullish Cypher pattern and entered in bullish potential reversal zone.
Lets have a look on the NEO priceline's move:
After initial leg (X to A) the A to B leg is retraced between 0.382 to 0.618 Fibonacci and then B to C leg is projected between 1.272 to 1.414 of A to X leg's Fibonacci projection and final (C to D) leg is retraced between 0.618 to 0.786 Fibonacci projection of X to D leg for a perfect bullish Cypher and then the price action is entered in potential reversal zone of this bullish Cypher pattern, Now we can expect bullish divergence at any time which will lead the priceline between 0.382 to 0.786 Fibonacci projection of C to D leg, but after this bullish divergence if the candles sticks will be closed above 0.786 Fibonacci levels then it can also lead to the long term bullish move.
I have used Fibonacci sequence to set the targets:
Buy between: 0.001213 to 0.001191 sats
Sell between: 0.001230 to 0.001272 sats
Regards,
Atif Akbar (moon333)
The harmonic moves analysis involves hours of hard work and determination however the success of harmonic trading in fiat and cryptocurrencies is around 80% therefore it is always important that you follow any stop loss strategy while trading harmonic patterns I have also shared a stop loss idea in this article, the information in this article is for educational purpose only this is not intended to be investment advice, I have tried my best to catch the harmonic moves as per predefined classical harmonic bullish Cypher pattern if you find any flaw or you have any suggestion feel free to share with me in comments section.

NEO - Inverse head and shoulders pattern?An inverse head and shoulders pattern is comprised of three component parts:
1. After long bearish trends, the price falls to a trough and subsequently rises to form a peak.
2. The price falls again to form a second trough substantially below the initial low and rises yet again.
3. The price falls for a third time, but only to the level of the first trough, before rising once more and reversing the trend.

NEO/BTC: Binance (3ple bottom)Bitcharge Binance Signals
1398/11/02
22/01/2020
Scalp
Binance
Pair: NEO/BTC
Buy: 1295-1300
Sell Targets
TP1: 1339(scalp)
TP2: 1380(short term)
TP3: 1400(short term)
TP4: 1450(mid term)
TP5: 1500 (mid term)
SL: 1245

$NEO showing green sproutsNEO still in weekly downtrend, however starting to look real good on weekly vs $BTC
Break of 24 month falling wedge
accumulation on convex structure, possible cup and handle continuation
break .0015 and the next resistance is at .0025 sats
fundamentals are also bullish for NEO
I will be keeping an eye on this one for the rest of 2020


NEO long signalAs you see all indicators are referring to long signals. so let's see the results later :)

#NEO in consolidation but we expect higher levels$NEO looks awesome at here. Breakout of the 1258 resistance and confirmed one. We can see a long consolidation below the level. More likely, the growth will continue and we will see $NEO much higher than now.

NEO Is Setup To Move Strong If It Can Stay Above This... 1000%+ NEO (NEOBTC) started to grow in late October 2019 after hitting a low in September. It managed to gain strong momentum and break above all major resistance levels in the form of EMAs, peaking just shy of hitting EMA300 (gray line).
After a strong bullish move, a retrace follows... and for NEOBTC prices remained really strong and quickly moved back above EMA200 (brown).
Now that prices are above EMA200, NEOBTC can easily make a strong jump.
The fact that the price hit just below 0.5 Fib. retracement rather than 0.786, is another bullish signal to keep in mind. With that side, prices can still move lower and a drop below EMA100 (purple line - 0.001199) would invalidate most the bullishness coming from this chart short-term, but we still lookup.
This is a good setup, NEO is looking for the long-run.
Here is the weekly chart:
Thanks a lot for reading.
Namaste.

NEO/BTC, pennant consolidationI am not a financial adviser, DYOR!
This is just kind of what I am expecting, i am speculating in advance but makes sense looking at this way. If pennant hold, should get a nice move up, so if you do enter, watch for that.

NEO/BTC ascending triangleNEO broke resistance and noe confirming ascending triangle setup, if this will work , we can see up move to around 10-15% range.
Overall we can see changing sentiment on market, usually if that happens, money flow first to major alts, than to mid cap ( for example like NEO,WAVES,Link,BAT ) and next to shitcoins and low cap coins.
We must wait couple days for confirmation this movement, but seems like this is play atm on market.
Fingers crossed :)


Possible Long Entry Cryptocurrency (NEOBTC) Update 05/01/2020Entry: 1224
Stop Loss: 1202
Target: 1311-1376
Risk/reward ratio: 1:4

NEO / BTC weeklysurprise surprise.... will neo surprise us in 2020 ? keep a close eye on it. daily and 4h also looking noice

NEO Long strategyNEO has broken down a channel with bullish tendency still beeing visible as RSI and the Ichi cloud indicating the bulls are still in it specifically I would like to state the support at the end of the cloud holding the price action for neo.
In case NEO finds itself over the cloud it will immediately complete a cup & handle on its way up to the resistance at top of the channel.
The buy demand structure shows a pullback scenario shall happen at the top of the channel.
The best safe place to place your SL has been placed on the chart.

NEO/BTC TA Update (Resume Uptrend?)NEO/BTC
NEO broke the downward trend-line resistance coming from the swing high at 1530 sats area. If the daily candle can close tomorrow bullish, I would expect more upside action to retest the swing high levels.
NEO bounces off 2 times at 200 Day MA acting as dynamic support during its strong pullback. This signals us a potential resume of an uptrend again.


NEO/BTC going to 13666 and then to 17366 satoshi? today we shill NEO, looking how strong BCH, EOS, and some bigger alts are doing, and neo to not do something?
cmn on, do something
entry: 1196, 1190 satoshi
margin:15
tP?
sl?

NEO FUN SHORT ICHINEO is under 1d supports with weak death cross, so short it to point of breakout on china fomo in past. Stop is close above 1d tenkan. Or, more conservative, above 1d kijun.

Local Support Double Bottom| Low Volume| Tend Change?Hello Traders!
Welcome to another update, todays chart will be on NEOBTC currently resting on the .50 Fibonacci level, will bulls have momentum to push NEO further up?
Points to consider,
- Trend change attempt
- Double bottom as local support
- EMA’s giving resistance
- Stochastics in lower regions
- RSI bouncing of support
- Volume clearly declining
A trend change will come to fruition if NEO holds this potential double bottom; this will put in a new higher low. The double bottom is in confluence with the .50 Fibonacci level, putting more emphasis on the importance on this level.
EMA’s are currently giving price resistance, will push NEO down if no bull volume comes through at current given time.
The stochastics are currently in the lower regions, can stay there for an extended period of time, however lots of stored momentum to the upside. RSI is bouncing of support, must hold, a break will most probably send NEO to lower levels.
Volume has declined rapidly, a clear indication that a move is imminent in either direction with in influx of volume.
Overall, in my opinion, a confirmed trend change will come from the respect of the local double bottom. A break of this level will increase the probability of NEO testing lower levels as the trend will still remain bearish.
What are your thoughts?
Please leave a like and comment
And remember
“Stocks are bought not in fear but in hope. They are typically sold out of fear.” – Justin Mamis