NEOBTC trade ideas


One more Wave; NEOBTCFinishing up the 4th wave. - can we grab 30% from the next wave?
Bullish RSI on the 12H, waiting for stronger signs on continuation on the lower time frames before I buy..
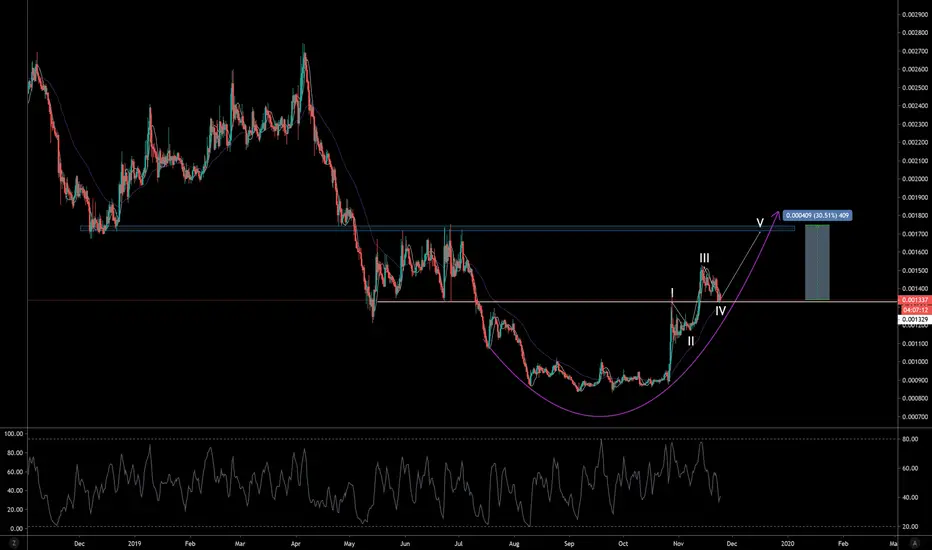
$NEO possibly finishing 25% moveOn the smaller time frame, NEO has made a double bottom in its descending channel. This could potentially send it up to the higher part of the channel to eventually complete its bull flag by breaking through resistance and finally meeting around the .0017 barrier. Volume is increasing (more noticeable on higher time frames). Keep in mind a double bottom on a smaller time frame doesn't have as much power, but it could potentially.
Stoploss at or around .0013.
Trade wisely and take this idea with a grain of salt as you should with all trading.


NEO - Exploding soonNEO fundamentals are good, China support blockchain and amazing Technicals showing accumulation 500% increase after 1200 satoshis price level is reached is very possible.

$NEOBTCBITFINEX:NEOBTC
It got to the target after breaking flat top triangle
Currently consolidation in flat bottom triangle and break lower can be traded to back test break from first one around 0.00125
Bigger picture is still bullish with target around big resistance around 0.00165/0.00170 area.

NEOBTC Bull Flag Formation | Strong Trend | key Level Holding Hello Traders!
Update on NEOBTC, which has proven me wrong from previous analysis (see chart linked), NEO has successfully broken bullish from its apex and is consolidating above the .618 Fibonacci Level.
Points to consider,
- Strong Bull Trend
- Key resistance broken, S/R Flip
- Price consolidating on support
- Volume Declining
- RSI respecting support
- Bull Flag formation
NEO has established a very strong uptrend since 26th October 2019, breaking key resistant levels, price is now consolidating on the .618 Fibonacci level, which was a previous staunched resistance.
Volume is clearly declining upon consolidation, signalling that a move will be imminent; we have a bull flag formation which puts emphasis on the probability of a continued bullish bias from current level.
The RSI has been respecting support, which is healthy in this trend, showing that buyers are in control at current given time. The stochastics is currently projected downwards slightly, but as we can see, it can stay in upper regions for an extended period of time (Blue highlighted area).
The VPVR is quite interesting, the volume of transactions increases as it gets closer to the blue trend line, which is a good area to take profits due to technical confluences.
Overall, in my opinion, NEO has a high probability of break bullish from this flag as we are in a strong uptrend. Volume is declining, which is what we need to see in a flag formation, we are also holding and respecting a key support, that is the .618 Fibonacci level.
What are your thoughts?
Please leave a like and comment,
And remember,
“Stocks are bought not in fear but in hope. They are typically sold out of fear.” – Justin Mamis


NEO/BTC Bullish Trade Idea.
Hi Guys Today I'm sharing my long idea for NEO/BTC
After Many pushes upward (with good volume) NEO seems to consolidate a bit before a new leg up.
.I'm planning to enter after a retest of the last resistance.
.This level is also a fibonacci retracement level (50-61.8%).
.I'm Targeting an old liquidity pool from the rally earlier this year.
Entry ~1410
SL ~1225
TP1 ~ 1500
TP2 ~ 2260
Have a good day!

Today`s ALT!!! NEOBTCBINANCE:NEOBTC
Exchange : Binance
Coin: NEOBTC
Buy Zone: 0.0012~0.0011
Target Point: 0.001295/ 0.00137/ 0.00142/ 0.001495/ 0.00165
S/L: 0.00108
Risk: HIGH
Term: Middle
You should be careful in buying NEOBTC because of Bitcoin
It`s making Bullish Pennant
The Volume is almost down
There isn`t Hard Resistance Line between 0.0015 and 0.00123
If it`ll break Pennant it`ll be pumping easily !!
=====================================================================
Today`s ALT is that information is raised regardless of the Coin market situation
So sometimes there`s a high risk trading
Investment is your responsibility.
I'm just providing about coin`s information
=====================================================================


NEOBTClooks ready for another breakout . 3x long NEO on Binance on a short timeframe , meaning 20% profits from this point.


$NEO, Looking good here as It flipped ~123k sats level..$NEO
Looking good here as It flipped ~123k sats level & is pushing up w/ volume
UCTS indicator showing a buy signal on the 1D
RSI at overbought (bullish) levels
EMA200 acting as resistance for now
Tight SL as always, lot of room to grow from here
Targets 150/160k sats
#NEO

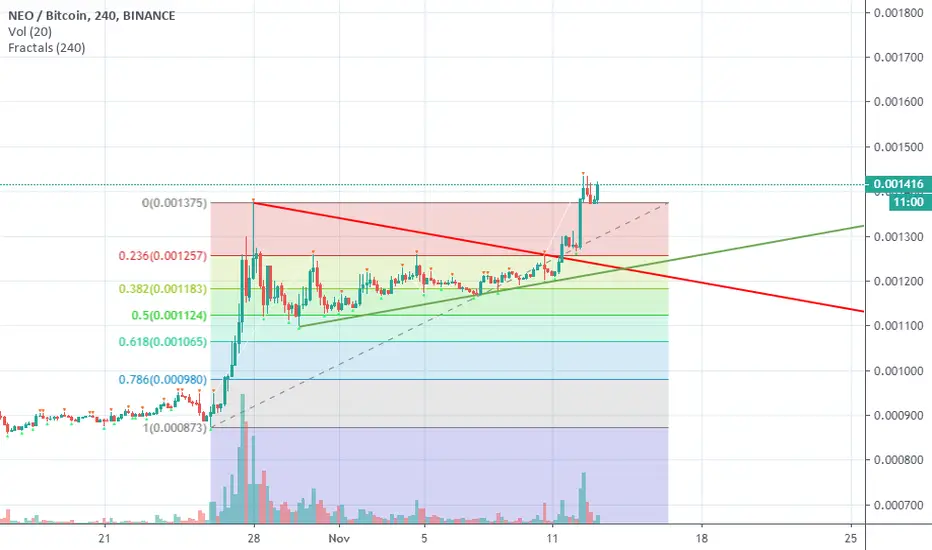
#NEOBTC LONG - TP 1464If you're confused with this chart, there are bounds on the x and y axis that bound the trade which ideally leave the trader insusceptible to emotional responses. Ideally.
The top dotted blue line represents the TP @1464 sats and the vertical purple dotted line is the time stop which, when reached, invalidates the trading idea and the trader closes the trade manually.
As you can see, after the time stop was reached, the trade started moving in the pre-determined direction.
-How should this leave you feeling?
-Would you ignore your trading rules next time?
Likely, you would. The desire to make money is greater than following the trading plan for most. After hitting my head against the wall for so long with this concept, I made trading about discipline and patience. An exercise. Similar to a workout.
It's really no different.
So, tap yourself in the back for following the trading plan next time. That's the only way to reach true wealth correctly.
Follow the (your) plan.


I love NEOwell as shown in chart NEO had a pullback on fibo and it has a good potential to go to the moon
but be aware whales are around here!
this is not a signal

Don't miss the great buy opportunity in NEOBTCTrading suggestion:
. There is a possibility of temporary retracement to suggested support line (0.001300). if so, traders can set orders based on Price Action and expect to reach short-term targets.
Technical analysis:
. NEOBTC is in a range bound and the beginning of uptrend is expected.
.The price is above the 21-Day WEMA which acts as a dynamic support.
. The RSI is at 82.
Take Profits:
TP1= @ 0.001700
TP2= @ 0.002100
TP3= @ 0.002725
SL= Break below S2

NEO Is Super Bullish | Can It Do 130%+ Next?NEO (NEOBTC) has a super bullish chart and is now moving above EMA200 (bold orange line)... This can lead to so much more growth.
On the chart above, we can see that the bulls are now in control with big volume coming in.
The MACD is really strong and allows for plenty of additional growth.
The RSI is also strong now reaching what we call "overbought"... It still allows for additional growth.
Additional details can be seen in the chart above.
NEOBTC printed really strong bullish momentum and now the bulls are following up.
We are looking at massive growth potential in the weeks ahead.
Do you have any questions or something to share?
Use the comments section below.
This is Alan Masters.
Namaste.
