$NEO Ascending triangle reaching to the edge against resistance $NEO Ascending triangle reaching to the edge against resistance at ~167k sats
UCTS Buy signal on the daily chart
Volume slowly growing..
nice trendline hodling the movement and producing HLs
Breaking above resistance could unleash some movements for #NEO, stay alert
#NEO
NEOBTC trade ideas

NEO – bullish pattern – 35% quick gain possible.Hi Guys!
We are sure many of you heard about NEO.
It made 350X gain in 2017 .
Will it repeat its success?
Well, maybe it won’t be as much spectacular as it was two years ago but…
Let’s take a look at the chart and indicators.
• The current price level is one of the lowest ever. This is the accumulation time .
• Ichimoku Cloud - The new bullish bar starts above the TenkanSen(red)
and KijunSen(blue) and the bottom of the cloud. GOOD.
• Weis Waves – The supply is falling down since the beginning of May.
Nice amount of demand has shown up.
• Bullish ascending triangle observed – our minimum target is 0.002300
• Further target possible – 0.002740
So this should give us a quick 35% profit according to the bullish ascending triangle theory .
Wait till this triangle is broken up .
What do you think?
Are you on board?
Thank you for reading.
Hit a like to support.
MASSIVE Hugs!
WBM Team


NEO/BTC : Compra arriesgada, pero con mucho potencialComprar breakout o retest.
No olvidéis darle a like si os gusta la idea :)
Un saludo
Trades activos
ETH/USDT :

$NEOBTCBITFINEX:NEOBTC
Trading in clear defined up channel. Made higher high and looks like on its way to 0.00185 or there about


NEOAfter the good news, we did not see big movements on the coin, but I absolutely understand that every time we touch the support line of the blue triangle and grow upwards. I think that soon we will break the resistance and fly much higher
RSI look good


NEO 30% gain chance NEO / BTC forming ascending triangle. Breakout with 30% gain on short term.
tippin.me/@alphy_88

NEOBTC potential moon.EMA20 ( in grey ) and 23.60% Fib are both broken. We have the volume coming in.
Buy up to 0.001666
Stop-loss: 0.001500
Targets:
T1: 0.001800
T2: 0.002150
T3: 0.002700


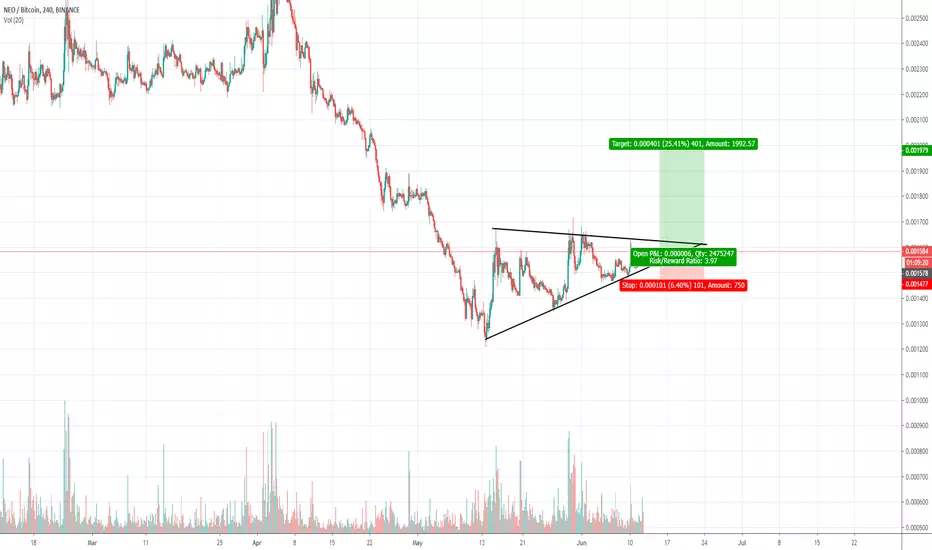
NEO is preparing for somethingNEO/BTC is forming an ascending triangle .
NEO many times bounced off of the rising support of the triangle, constantly creating higher lows .
The ceiling was tested many times, so next time 0.00163 expected to fail.
Targets for a breakout to the upside on the chart
Breaking down invalidates the pattern. Always practice risk management.
Fundamentally NEO prepares for something big. NEO has so little attention today with this new coins, but accumulation we've seen on NEO looks impressive. NEO 3.0 coming next year can potentially be a game changer.
If you like the idea, please, do hit the Like button and subscribe to the profile in order not to miss our updates!
The information given is never financial advice. Always do your own research.

Binance, NEOBTC, will have Jackpot?Reversal: 1557-1587,
Demand: 1458-1519,
Target 1: 1661-1687,
Target 2: 1717-1734,
Target 3: 1787-1824,
Target 4: 1877-1921,
Jackpot: above 1976

NEO; heating up long on break Once we escape from the box I foresee a bullish trend to emerge.
long on break

Long on neoNeo is struggling to get into an uptrend, and probably put in a bottom here. Buying the reclaim of daily 21ema, expecting it to flow towards 235500 sats over time. This is a high market cap shitcoin so it will take some time to move, I think there are definitelly faster movers like chainlink or matic, but they do carry more inherent risk than tried and tested Neo.

NEO BTC Ascending TriangleThere is ascending triangle pattern on 4H Neo Btc chart. For safe entry, candle close above red zone should wait. For agressive entry, you can choice a near place to support trend.

NEO Continuation of Uptrend - Breakout AnalysisClear repeat of prior fractal pattern. Consolidation along continuation support line. Looking to catch breakout move upward.

NEO/BTC is developing Rising Wedge PatternNEO/BTC - 1D
Reasons:
1/ Price is forming a Rising Wedge Pattern
2/ 10DMA is above 20DMA
3/ 10DMA & 20 DMA are about to cross up 50DMA
=> Bullish short term
Target:
0.0017BTC (10% profit) at previous support/resistant
Stop Loss: 0.00146
NOTE: Rising Wedge Pattern: 31% Break up. 69% Break down (continue)

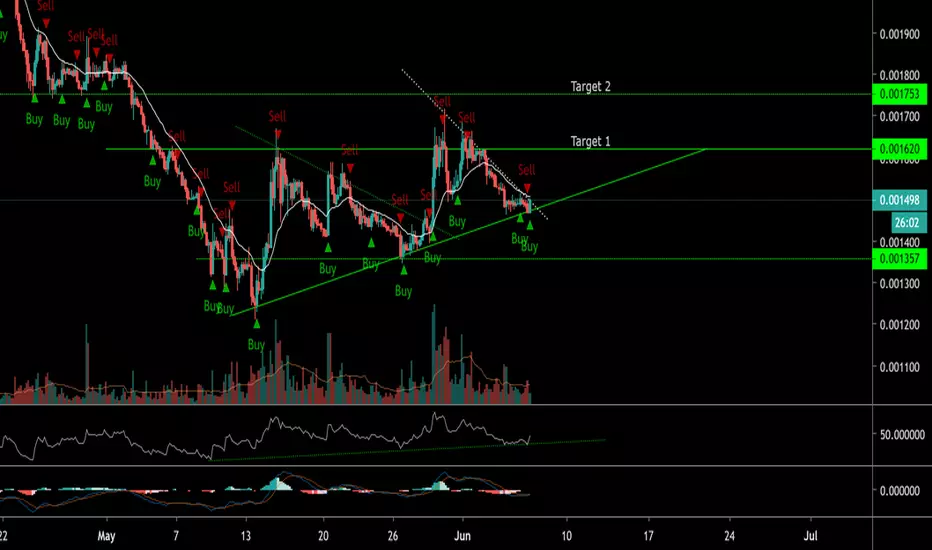
NEO forming an ascending triangleNEO seems to be forming an ascending triangle
RSI is bouncing off the trend line
MACD is raising
SBS indicator signaled BUY
BUY at the break out of trendline (white) or closes above EMA 21
Targets are on the chart
SL -5% of buy-in or below last support
NEOBTC: 1 Hour Time frame Chart PatternsConclusion for today's NEOBTC analysis: Price closing above ~0.001665 implies more bullish upside in NEOBTC
Intraday timeframe analysis of NEOBTC is presented using a candlestick chart. April 05, 2019 to May 14, 2019 saw NEOBTC remain inside of a bearish channel that is shown on the chart with a breakout following a day after.
The bullish implication of the breakout is currently still active even though a sideways movement has resulted. The upper and lower boundary of the ranging environment for price that has lasted over 3 weeks is also drawn with NEOBTC currently trading in the middle of the range.
The best course of action is therefore to wait for further price development to ensure the continuation of the May 15, 2019 bullish breakout.
Buying above the upper boundary of the range i.e. 0.001665 can be considered as part of a conservative strategy or even buying above the May 30, 2019 price high of 0.001713.
Initiation of long (buy) orders prior to breakout is hence considered less conservative. This is due to the fact that it is not yet certain that the ranging movement is complete and prices having a chance to even head lower to test support between 0.001412 and 0.001356.


Buy setup short term. Neo is resting on 618 fib levels accumulating for bullish move t the upside.
You can buy on this level.
