NEOBTC could push if bitcoin dropsbitcoin is going up, so altcoins are dropping. if btc will have slight pullback and will be running sideways, it could be the time for an altcoin season. thus neo/btc would rise.
NEOBTC trade ideas


NEO/BTCHello Friends,
Not much to say here, looks like the ascending ABCDE channel is yet to hit it's mark. The Bill Williams Fractal says no buy yet on the daily however the weekly chart is beginning to form a inverted hammer candle as is the RSI nearing oversold. I would wait a bit longer before buying into this ALT and see where it will head in the following days. If the weekly candle closes as an inverted hammer candle, that should put NEO into or near oversold RSI and at the projected daily chart of the predictable channel towards its target for a bounce upwards for a change of trend. Observe on this chart the stop loss and the buy zone.
Details on the Chart.
This is my viewpoint and my opinion. I am not giving advice but only sharing what I see. Do not enter a trade on my TA but do your own homework.
Cryptocurrency is volatile and very risky. Never invest what you can't afford to lose and always educate yourself and continue to do so when making any kind of investment.
If you find this information helpful, then please hit the like button . Your support is appreciated. Thank you!
CYA on the next one...until then, the trend is your friend. Buying on the dip and selling on the hype.
Cheers!

NEOBTCNEOBTC update
Entonnoir : W/D/H4 (swing)
Scénario de rebond complètement invalidé puisque NEO a non seulement cassé l'ancienne compression weekly (blanc) par le bas mais aussi sa zone de S/R ATL.
Reste à voir si on va finir par rebondir quelque part vers les ~1500 mais personnellement je ne me risquerais pas à long cette paire avant une réintégration du dernier creux weekly vers les ~2200.
—————
Funnel : W/D/H4 (swing)
My rebound scenario has been completely invalidated.
NEO broke out of the old weekly compression (white) by the bottom and also broke its ATL.
Let's see if we can have a rebound at the ~1500 level. Anyhow, I would not enter this pair before the price reintegrate its last weekly bottom at ~2200.

This is what I see right nowFYI my trend lines are drawn on the monthly.
To me it appears NEO is hitting the bottom trend line in a falling wedge, from here we either break below 1500 and free fall as others are saying, or we hold and bounce back to the upper trend line of the falling wedge. What do you think?

NEO/BTC next move! Testing Fib 32%NEOBTC has a lot to gain before start the main move.
Just to test its Fib 0.32 (if we have already passed the bottom) is going to be around 400% gain from today's price.

$NEO Sitting at ATL BTC Support at around 177K sats...$NEO Sitting at ATL BTC Support at around 177K sats...
UCTS Sell signal Active on the daily (27% down since the signal)
If this level fails to hodl, We will enter into price discovery for a new support
For now I dont see bouncing/reversal signals
#NEO

NEO/BTC NEO/USDT good time for buy NEOjust buy a f#ck1ng neo and you will be rich soon
div 4h + good support.
just buy and keep.

NEOBTC reaching interesting prices!NEOBTC is reaching interesting prices vs. BTC. It is also a commonly traded USDT/USD pair. We anticipate it to following BTCs rally.
Buy at:
0.001731 - 0.001700
Target 1: 0.001836
Target 2: 0.002210
Target 3: 0.002550\u2028\u2028Stoploss: 0.001665

NEO ~ REVERSE AFTER DOUBLE BOTTOM? Hi Folks,
are we going to retest bottom again? Or NEO will keep Sinking??
Let me know your thoughts.
If you like my TA put thumbs up :-)
Thank you
Happy and Succesful trading day


Is NEO Dead? Or Is The Bear Trap We've Been Waiting For?Let us return to the bear trap idea I posted about a couple weeks ago. On April 16th, I speculated that we'd see altcoins continue to drop on their Bitcoin ratios, but that it wouldn't last too much longer. Indeed, NEO slid lower, even beyond the point I was even hoping it would bounce. However, the "bear trap"/ terminal shakeout idea is still in play.
During the end of an accumulation phase, an asset will often experience a test of lower support levels. For NEO, the price decrease happened on low volume after a massive volume spike that took us all the way up near $14, after bottoming in December below $6. Since then, we've corrected down to the $9 area (a healthy retrace, in my opinion), and have begun forming what could be a double bottom on the Bitcoin ratio.
AS LONG AS Bitcoin doesn't drop too much here, I think we can expect NEO to bounce. News for NEO seems to be pretty good, as they just released their Roadmap, which is both ambitious and promising. Activity in their community seems fairly strong. There's no reason to assume the project is "dead." Whether or not it achieves anywhere close to its ATH in Bitcoin value and USD value in the future remains to be seen...but I'm still holding it.
Additionally, if we look at volume, we had a spike just yesterday when we bounced a bit. This is bullish for NEO, since I'd be more worried with an increase in sell volume. That's not the case here. On the contrary, NEO has experienced nothing but large buying volume recently. This tells me we are in a strong demand zone. If Bitcoin does break down, however, NEO could head down to either test the $5 support or even make a new low around $3.70. For now though, I will assume that these levels will continue to hold. I could be wrong. I guess we'll see.
Since so much trading already occurred between 2000 and 2400, I wouldn't be surprised to see a much faster rise. The same could be said for XLM, which may also be experiencing a similar shakeout.
In summary, these are my criteria when looking for a possible terminal shakeout/bear trap (all of which occurred before the ONT rise as well):
1) Fakeout pump on big volume
2) Low volume dump to below psychological support
3) Accumulation on periodic high buying volume
Result: Massive green candle, or BGD and then markup from previous high.
So far, NEO checks all three boxes. Let's see what happens. Here are some possible targets if it bounces from here:
1970
2150
2400
2700
3300
4600
This is not financial advice. Just something I've been looking at. This is meant for educational purposes only.

$NEO / BTC Long. Swing Trade set up. OBV holding upward trend. Stoch RSI cross in upward direction. At & Near support/ ATL. Good amount of buy volume coming in. Long. T1: 0.002, T2: 0.0022.

NEO/BTCI think NEO might take a run up after breaking a hourly downtrend and coming down to touch a 4 Hourly.
It also is coming close to testing it's ATL at 1670.


$NEO, starting to show signals of bounce ...update on $NEO, starting to show signals of bounce from the 2nd support that we were tracking around 1750sats...
Volume starting to rise
UCTS Buy signal on the 6h
RSI leaving oversold levels
I would like to see a break above ~1900 with volume as confirmation of reversal
#NEO

$NEO Reaching a good support area at ~1900sats..$NEO Reaching a good support area at ~1900sats
If you are looking to accumulate #NEO, this could be a good area to start laddering your buys..
I expect a more downside on the upcoming days (at least till RSI hits oversold lvls)
Will update as soon as I see relevant updates!

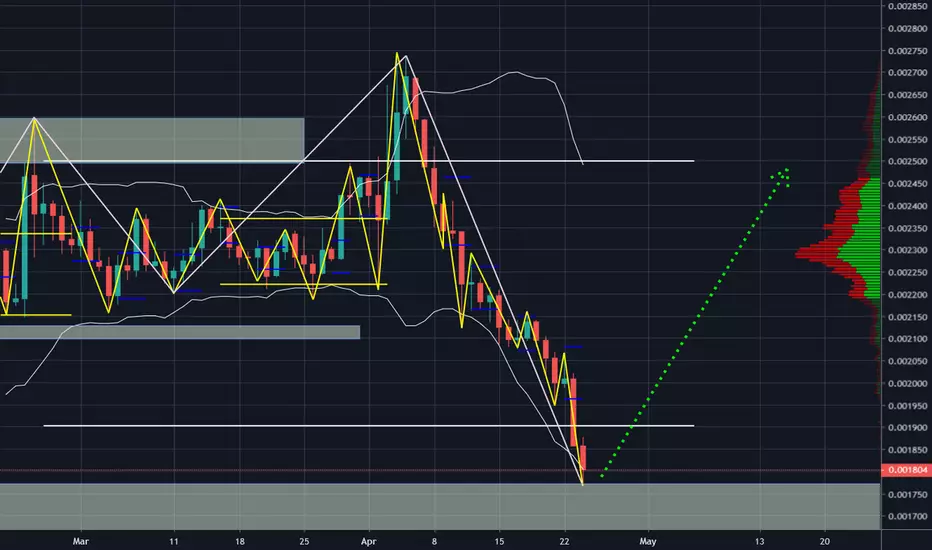
NEOBTCNEOBTC update
Entonnoir : W/D/H4 (swing)
Je n'avais plus analysé cette paire depuis longtemps puisque nous n'avons jamais réussi à passer cette zone de S/R des ~2500. La seule tentative s'en est suivie d'une réintégration de la compression weekly (blanc) à la baisse, et donc d'un biais baissier, et que je ne trade pas les alts à la baisse.
Actuellement, le prix vient de casser la compression weekly par le bas, ce qui est en fait une très bonne nouvelle contrairement à ce que l'on pourrait croire.
Non seulement le prix est pile sur le ATL et donc fort peu propice à aller plus bas mais plutôt propice à rebondir dessus (flèche verte en pointillés), mais en plus de ça s'il rebondit et réintègre la compression weekly, à la hausse cette fois, ce sera un excellent point d'entrée puisque je le rappelle, ces réintégrations de compression pourfendent généralement la compression de part en part.
De plus, le cycle daily (découpage jaune) en est déjà à sa 5ème impulsion baissière et donc très vieux et suceptible de se retourner.
Je vais donc attendre pour me placer sur le rebond potentiel sur cette zone de S/R weekly des ~1800.
—————
Funnel : W/D/H4 (swing)
I didn't perform any TA on this pair since a while as we never made it above the zone of S/R at ~2500. The only time we tried was followed by a pullback on it and then a reintegration of the weekly compression (white), meaning a bearish bias and as I don't short alts it wasn't interesting for me to follow up.
Currently, the price has just broken this weekly compression by its bottom which is actually a good thing because now the price is right on an ATL zone of S/R and very unlikely to go lower but more likely to rebound on it (green dashed arrow). And if this throwback happens, it will probably also reintegrate the weekly compression which would be very bullish for what's next as this reintegration setup is often ending by the price going all the way up to the top side of the compression.
Nevertheless, the downtrend daily cycle (yellow drawing) is already at its 5th impulsion wave and therefore very old and likely to turn around.
Therefore, I will wait to go long on a nice throwback on this zone of S/R at ~1800.


NEO, ONT, and XLM - Comparing Terminal Shakeouts Even though I've been leaning a little bearish on the market recently, since a lot of altcoins have broken their mid-term uptrends against Bitcoin or even headed back to major support levels...the USD value of many altcoins remains fairly bullish for now. NEO, for instance, is still above $10, despite drifting down to lower supports on the Bitcoin ratio. Much of the recent bullish action on NEO has occurred with massive volume. Meanwhile, our current selloff is occurring on low volume. This is exactly what happened with ONT before it went on its major run, where it tripled in USD value in several weeks. Additionally, the consolidation period after the November selloff has also occurred on higher volume than the drop.
A while ago, I posted an educational video about why I entered a long term position on ONT at $0.60/1700, and how I was able to spot accumulation (the link to that video is at the bottom). I also saw it occurring with ICX, which is why I posted the video on the ICXBTC pairing. Looking at the NEOBTC chart, we can see that it's printing a somewhat similar pattern with a similar volume profile as well, albeit on a much larger time scale. One of the major differences is that NEO made a higher high before dropping, which indicates that buyers do still exist for NEO. The rejection is a bit more concerning, which tells us that NEO isn't as strong as ONT, for now. Investors are concerned that NEO will continue to lag behind the rest of the market, as it has really fallen from its former glory. Here's the ONT chart from its recent bottom:
I'm presenting this comparison because I think there is still hope for NEO. It's certainly possible it heads to new lows, but the volume profile tells me there is some decent interest at these recent price levels. When ONT rose from $0.50, there wasn't really any major news to back it up. The market simply decided it was undervalued. I'm still holding my long term position on NEO (having bought it with my TRX back in early January). NEO has still performed better than TRX since then. Additionally, a similar "terminal shakeout" could be occurring with XLM, as that one is also drifting lower on decreasing volume after a period of huge volume accumulation:
Based on my chart, even if NEO is to rise again eventually, it still may need to fall to a lower support (indicated by the red X). After my previous analysis, NEO hit my first target between 2600 and 2700, but only to get rejected hard. The good news is, the 2400 resistance might be a bit weaker now, should NEO eventually get back up there.
Looking at the USD chart, you can see it looks much more bullish than the Bitcoin chart. We have some room to go down there, and we still haven't broken our uptrend on that pairing. If NEO is to rise eventually, it could take a while to break the $14 resistance, as it was previously major support (that was my target in USD value on the recent run up). The market needs time to accept current prices after such a severe decline, so some consolidation would definitely be welcomed. it would give a good opportunity for buyers to support a new floor for the crypto sphere. Of course, If the uptrend fails to hold, it won't be good for NEO, or most other altcoins for that matter.
Anyway, this is not financial advice. This is just a post I wanted to make, since I thought it was interesting. I hold both ONT and NEO, and I'm curious to see how they both continue to evolve.
-Victor Cobra

NeoBtc Trading opportunitySpotted potential ISHS which trading inside falling wedge with the right should will like be a re-test on the wedge level.
Kindly follow the suggested accumulation zone on the chart and always remember to apply stop loss.
Level to watch for are:
POSSIBLE ENTRY ZONE
Possible Support LEVEL
SELL TARGETS
Do know that I appreciate your effort and the time spend in reading and watching my posts and Please leave a LIKE and FOLLOW us for more updates.
Thank you
Note:
It will be good to always understand risk involve in trading. Always trade with stop Loss in place.
Set up an entry/exit strategy for every trade, with good risk/reward ratio.
