NEO Long PlayNEO appears to be bottoming out around 0.0021BTC. On the right chart (60m), you can see the ascending triangle forming. If the volume is weak the breakout may only go to the 0.5 Fib level around 0.0022BTC. Watch Volume at the Yellow Circle in breakout above triangle occurs. However, with sizable volume, a breakout could send the price back up to the bottom of the red Ichi Cloud with a short consolidation back to the 0.5 Fib. If NEO bounces back up from this level through the red Ichi Cloud, next break up can send price to 0.0025BTC at the 0.236 Fib level. Volume is very important for this rally as volume has dried up significantly on the daily.
NEOBTC trade ideas

NEO: Is there a possibility to enter the market?Currently, the ’’Chinese Ethereum’’ is trading at the positions of the first days of February. The coin is located is the descending channel from April.6 and still not able to recover.
A potential trend change is possible if NEO achieves the 220k satoshi mark and trade there within the next few days. However, it is late to talk about such a scenario as trade volumes are too low. Only, in case they increase, bulls can enter the market.

NEO: I gotta Golden Ticket Neo is setting up nicely to make a wave up. It's undervalued at the moment and has lots of room to grow. Don't underestimate this one. It's a real contender to Ethereum with many exciting projects being developed ontop of the NEO Blockchain. As always, good luck to all!


It gives you gas bruvYou know colours? Then you know that we need to confirm red as support b4 foing anywhere. sell the green buy the red. easy af tbh

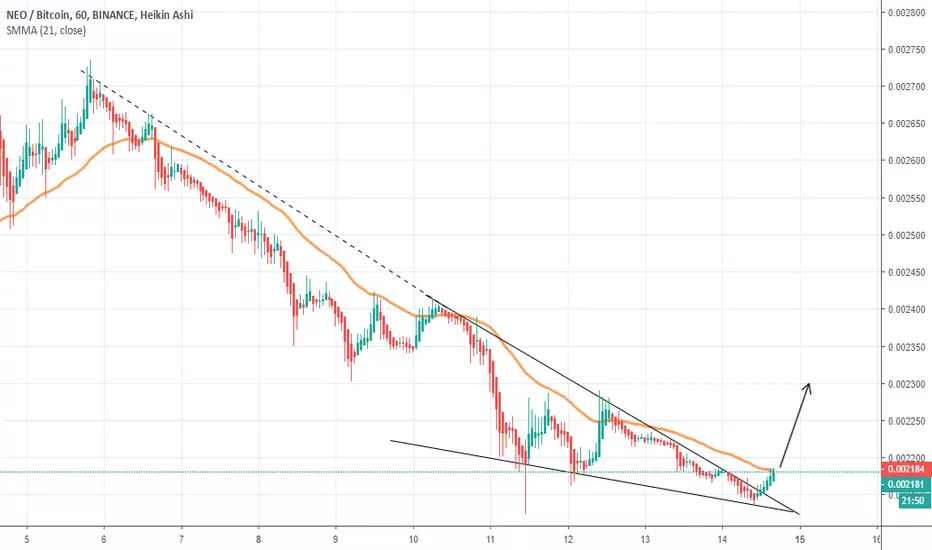
Trading plan NEO/BTC and NEO/USD 4/17/2019Hey!
We recommend to consider buying on the specified pairs.


Neo Gearing To Go LongNeo looks like it has a little more steam before we see a decent run to the up side.
Looking to bounce and enter at the 0.0020btc level.


Daily Bullish Signal $NEO #NEO #NEOBTC #BTC $BTC (14/4)RED ARROW indicates the EXPECTED Time and Targets
Level Stoploss point up to maximize profit and reduce risk
I'm working all the time, even in Bearish Market
======================
My path doesn't seem like anyone. I'm like a MONK, always studying to find the direction that prices will follow. I will feel very comfortable if the price goes exactly in the direction I drew. I will always try and practice until PERFECTION is MY OWN

Neo about to GONeo inverse head and shoulder .. break that neckline and il take 35% off the table :) yeeeehaw


NEO ~ There is 2 scenario. Previously I This 1st graf might beHi Folks,
I have called couple of days ago about NEO to gain 15%. WE might get it or we might see and dip even more till reach second Demand Zone.

NEO New trade idea , Set buy at 0.00227000 for 0.00282 targetNEO New trade idea , Set buy at 0.000227000 for 0.000282 target
it's our last trade , and achieved our target
Mid target 0.00340000
hope great trading day


NEO potencial 15% gain Hi Folks,
Neo was trading side way upward. I think it will try to find support Zone and Demand Zone where Bulls would be ready go Long.


NEO still losing momentum - The China slowdown is real #notethNo doubt I am going to get blasted by the hordes of NEO fans and shillers here on TV HOWEVER - I just can't help myself, I want to kick it while it's down.
Simple technical analysis on the chart. Basic support and resistance levels being monitored.
For now I am going for what looks like an easy margin leveraged short on NEO - Feeling pretty confident that we are going to taste profit target long before we see a genuine recovery.
Looking to go big fat, wide and heavy on it - Some of this is revenge for a past dance that I am still angry about ;)
As always these are my trades, my risk, my ideas and opinion - it is definitely NOT direct trading advice in any way.
Feedback, thoughts, likes and shares all very welcome - even an opposite view, all fine by me I'm here to share and enjoy the banter.
Good luck and happy hunting to all.
XOXO MysticCrypto

NEO INTRADAY - Trade The ReboundNEO is rebounding off it's major bullish trendline. Expect price to rise 5%+
A momentous break below the trendline will invalidate the trade.

NEOBTC rising channel and at strong support. Good entry point at 2470 for a small position aiming for 2700.
Careful of Btc pump may cause drop to bottom of channel at 22~~

NEO trade +32%, big target +72%This is my first prediction. I used simple trendlines to spot this opportunity. The biggest issue with this one is that Bitcoin might collapse in the following days and it might bring NEO in his way down.
If the stop-loss is reached, I only lose 2% of my portfolio so it's worth a try!
