NEOBTC falling towards buying zoneThe price action is likely to have drop towards 0.618 to 0.786 fibonacci retracement for harmonic formation.
The 100MA is already in buying zone which can play the role of strong support to bouce back the price line insha Allah.
The targets are defined accordingly plz find on chart.
Regards,
Atif Akbar (moon333)
NEOBTC trade ideas

NEOBTCForming bullish butterfly near median line and good support from green area made me think of move up toward the upper line of pitchfork. lets see what does it do with support.

NEO -MoveNEO is looking like it might have more upwards momentum. NEO broke the resistance line after a bounce on the 21 ema. That means that the seller were strong after a hit of resistance.
Buy & sell positions in our crypto signal scanner (comment).


NEO Looking Good in the Short-Term
Flat-top formation on $NEO on the daily resolution. That’s almost always bullish as bullish gets. This is formally known as an ‘ascending triangle’.
Super long-term downtrend resistance spanning back to April 28th, 2018 got broken:
Relative Strength Index
RSI(7) can definitely grow from where we are currently. Looking bullish.
Exponential Moving Averages
Price > EMA-12, EMA-26, EMA-50, EMA-100, but not EMA-200 (overhead as resistance).
EMA-50 = .2134 ; That’s a support point.
EMA-12 > EMA-26 > EMA-50 = Bullish ; positive. EMA-100
Let’s zoom in to the H12 resolution:
The Zerononcense Reversion Ribbon V2 is showing some serious convergence on the H12 resolution.
The crossover to indicating positive price action appears imminent.
Other Momentum Indicators (H8 Resolution)
Momentum indicators on the H8 resolution look positive for $NEO.
Conclusion
'$NEO (in the short-term) is looking very positive. Let’s see where it goes from here.
Important thing to note here is that the ascending triangle (flat-top formation) is strong for $NEO. It spans back several weeks (going back to 2018) on the daily resolution. Usually patterns like this can result in explosive growth.

NEO to the moon !Break out resistance line of triangle
Above MA50,100,200
Stochastic RSI oversold - bullish.
Going to the first fibonacci level
To the moon !
Strong news coming soon;)

NEO - Not ready to Die...I posted a week or so ago about NEO. Time to revisit
12Hr We broke up above the cloud on the 12th of Feb, and have not closed within the cloud since: Bullish
- We still have green skies ahead: Bullish
- Chikou Span is above Price still: Bullish
- Looking to close above Tenkan and Kijun: Bullish
MoMo (Bottom Oscillator) The slow line is above, and failed to drop below the 10 line - While the Histogram (faster moving) went down, and is turning up again, this is a sign of a Bear Trap.
3Hr We punched through the cloud and retested it and bounced: Bullish
- The Cloud is Bearish but we have a Kumo Twist inbound: Turning Bullish
- Chikou Span is above price now: Bullish
- Kijun and Tenkan have squeezed, it will be a couple more candles before we see a TK Cross: Turning Bullish
MoMo Both the slow and the Histogram have turned up, this is a strong buy.
We have a bunch of resistance above, So I feel we have some more sideways movement before we break up. NEO needs to wear out the sellers, but there seems to be a lot of pressure building up here which would lead to a strong break.

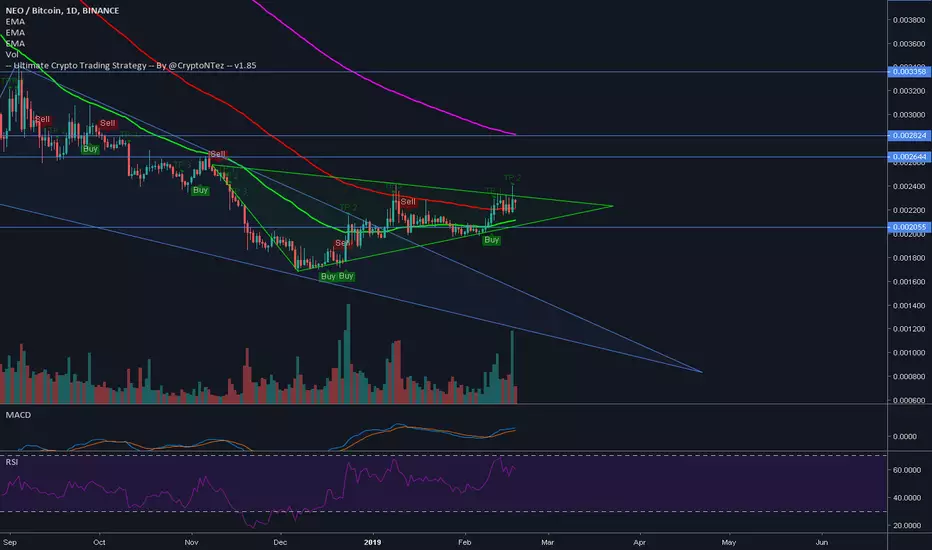
EMA50-EMA100-EMA200 aligned like December 2017!update, trying to break from the green symmetrical triangle to the upside.
MACD bullcross, RSI rising. Spike in volume and UCTS buy signal.
Fun fact: EMA50-EMA100-EMA200 were not aligned this way since December 2017


[NEO/BTC] / IMPORTANT LEVELS (BREAKOUT)I'm expecting a major rally if neo/btc manages to break yellow resistance with big volume;;
I'm accumulating small positions within yellow box and waiting long term;
Goood luck to all

Triangle could be breaking soon!Triangle trying to break above. Currently holding at EMA100 (red), Volume looking strong, UCTS buy signal active and currently positive.
Breaking above (following the rest of the market) will take us to ~2600-~2800-~3300 sats. #NEO Set alerts and wait if happens!

NEO Pre-PumpCheck November 2018 period. Deep into bear market, no volume, crypto is dead. Followed by big selling volume and consequent price drop just as it was bleeding. That seems like the final flush, immediately followed by buying volume as price holds. Just looks like the classic "dumb money" selling into "smart money"
NEO has some proper whales given it made a massive pump. Used to have plenty of liquidity.
Volume keeps coming in, liking the structure. It may take a while but this one is definitely something I'll be keeping my eyes on.

Neo Breakout LevelsNeo is following a rising wedge. With many other cryptocurrencies charting just like Neo, we could see a mini alt season in the coming weeks/ months. Bitcoin looks like it should retest 5.8-6k resistance in the coming weeks so we could see some nice gains if Bitcoin also breaks out.

NEO/BTC 1D, targets and scenario. Price is stuck under the first local resistance zone (blue). To continue a bullish trend, the 1D candle should not be closed below the blue zone.
This coin will be interesting to purchase if we price can go through the local support (blue). The goal - edge of an orange block. Otherwise, we will go down to test the "rocket level". If it breaks - we will go to the "B" zone.
2 possible scenarios I marked in the chart!

NEO Bullish potential This is a speculation on what will happen with NEO. Mind that i don´t have a glass sphere where i can for see the future with.
The first thing i did was finding the resistance and support levels. I used the volume to identify them. I moved on seeking for a pattern i couldn't find a clear one. So i wrote down a line from top to top and from bottom to bottom. I think there is potential in NEO because. There is a buy signal in the MACD and the trend is increasing.
The D in the graph is for the distribution of GAS on binance.
best regards, Junktard

NEOBTC - 20% GTDBuy Price:Green Zone
TP: Blue Zone
Support: Orange Line
Resistance: Purple Line
SL: Red Zone (I don't recommend to sell in loss.)
Invest Suggestion: 10 Percent
Profit Expectations: up to 70%
Neo can suffer a retraction before explode... it broke the downtrend line and its testing a strong resistance right now! HMA's are in excelent position!
Elliot waves are very similar when Neo explode in 17 Dec 2017 and 07 Set 2018 .
See me previous analysis and how profitable the are!!!
Sell when you get some profit, according the way you trade.
Keep following us and please like this idea.
Any doubts? Send in the comments or in our telegram or Inbox here.
Thanks for visiting.

NEOBTC Long1-Technical analysis:
#Classic Analysis: Down trend line breakout in daily time frame
#Indicators: bullish signal in Ichimoku & Volume approval in volume candles indicator
#Harmonic patterns: bullish bat pattern happening in weekly time frame
#Candlestick: bullish weekly candle and bullish trend in daily candles
2-Position details:
*Entry: green zone’s breakout
*Stop loss= 0/00167482-0/00172024
*Take profit 1=0/00335613-0/00340952
*Take profit 2=0/00463700-0/00470398
*Take profit 3=0/00650623-0/00674032
*Profit/Loss ratio= 1/25 minimum (based on TP1)

NEO - Pre FOMO signs are hereIncrease volume. Bullish on the weekly.
Buy, wait a few weeks and profit


