NEOBTC trade ideas


Want to catch a knife?
NEO/BTC at the bottom of its support.
RSI below 28, historically NEO gets mini pumps when RSI is oversold.
Long for a scalp.

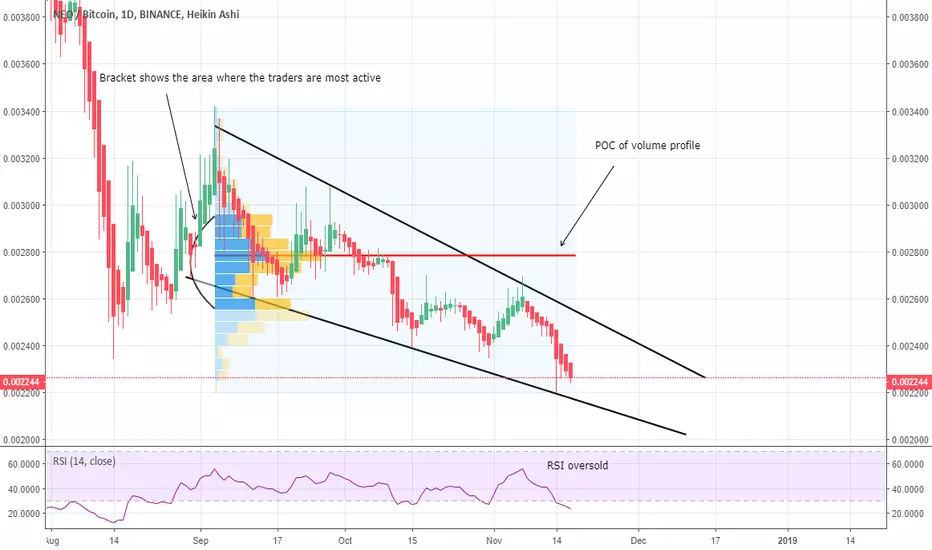
NEOBTC, falling wedge getting ended with a massive breakout soonThe price action of NEOBTC is in a falling wedge since 30 aug, now the RSI and stochastic are in oversold condition.
I took the fixed range of volume profile of almost complete wedge's priceline and it is showing that the trader's interest is weakening at the support and on resistance or even
above the resistance interest of trader is strong which is giving signal for upcoming breakout which can lead the priceline atleast to the POC of volume profile insha Allah.
Best of luck and regards,
Atif Akbar (Moon333)


NEO/BTCNEO/BTC
NEO launched from demand zone (green area ) targeting 1st target at 0.003030 and 2nd target at 0.0032500 stop at 0.002200 will be good

NEOBTCIf price close with two candles above 0.002501
buy :
0.002501
Sell :
Level 1 : 0.002668
Level 2 : 0.002831
level 3 : 0.002994
Stop :
close of two candles under :
0.002501 ( price can go down to 0.002416)

$NEO / $BTC Can we see a pre-pump Fork? one to watch$NEO / $BTC Can we see a pre-pump Fork? one to watch. waiting for bang of Volume.
+Div on daily chart is obvious , Price is around ATL and Fork is on 10th Nov . Lets see how this one plays.
NEO Scoring
Overall Score: 79.3%
Open communication channels: 100%
Team strength: 46%
Product strength: 78%
Coin strength: 83%
Brand awareness/Buzz: 100%
Advisory board strength: 0%
Activity on social media: 50%
Quick Research
Purpose: NEO's blockchain addresses scalability issues that older blockchain have. Also, its platform offers dApps, smart contracts, token issuance (NEP-5 tokens) and more. It is popularly referred to as the "ethereum of China" due to the similarity in functions with Ethereum and its Chinese background.
Product Status: Fully working product
Consensus Method: Byzantine Fault Tolerance
Emission rate: Emitted in proportion to amount of network activity
TXN'p/s: 1000
Abstract:
AntShares is a smart asset platform and the first open source public blockchain project in China. Smart assets are the combination of smart blockchain contracts and digital assets, making registering, distributing and trading digital assets more intelligent.
Investment data
Listed on 19 exchanges
CoinMarketCap Rank: 12
Market Cap: $2 B
24H Volume: $65 M
Coin Age: 21 months
Circulating Supply: 65,000,000
Total Supply: 100,000,000
Max Supply: 100,000,000
Rank :15
Upcoming News & Events
Title: NEO Super Fork
Date: 10 November 2018
Description: Fork NEO Super planned for 10th November. Each NEO holder will receive 2 NEOX tokens for each NEO.
Title: Second Blockchain Week
Date: 14 January 2019
Description: Second annual CHAINERS Blockchain Week from Jan 14-18.

$NEO Preparing for a moon launch!We see a lot of Alts took off except some, including $NEO...
Bullish Points:
1. Kijun Kiss (let's wait for a crossover).
2. Senkou A is pointing upwards while Senkou B is Flat, indicating a possible future kumo twist.
3. Slightly Thick and flat Kumo cloud above price indicating a possible trend reversal.
Neutral Points:
1. Chikou Span is in the price range, but when we get a cross over it will go above price which is bullish.
Bearish Points:
1. %R is pointing downward but it is >50 so it is still bullish. however, we have not yet seen it turning direction which I assume that we may have a retest of Kijun-Sen or Tenkan-Sen.
We are going to take a long once price is inside the cloud and a cross over happened, or let's wait for the price to completely get off above cloud. Your choice, but personally, I would enter once a cross over happens and price is inside the cloud.

NEO 400%++, NEO is in the buy zone and ready to take offWith good volume and alongside of rising Bitcoin, we will see NEO rising from the ground once again


NEOLong time NEOBTC show free fall. We reached support zone - accumulation zone.We must start flying from this zone. First we need break out resistance line of the wedge. Target first 3 fibonacci levels


NEO COIN 50% Target ...!! Time For LongNEO COIN Are Sleeping on the Bottom Finally Break the Triangles and Rising Start to up side.
Now We Can See a Rally in NEO Coin.


Waiting for Breakout and Pump!!MACD in time frame D1 has converged with price => Bullish signal
Right now, prices are facing important resistance. This resistance combined with the stoploss line forms a familiar triangular pattern
If the price breaks above the triangle pattern, it will be a PUMP for NEO
Buy zone: 0.002540 - 0.002490 or Buy breakout at 0.002710
Stoploss: 0.002330
Target 1: 0.003310
Target 2: 0.003930
Target 3: 0.006180


