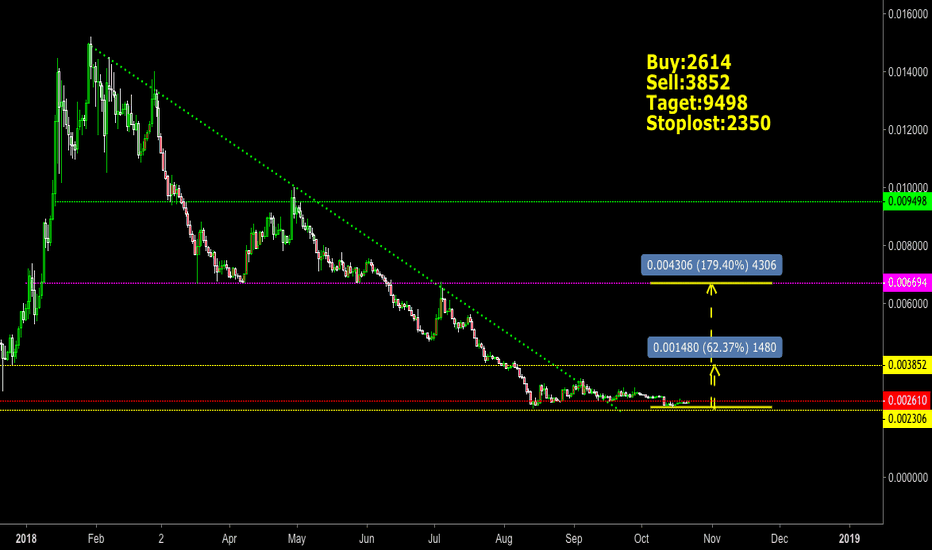
NEOBTC trade ideas
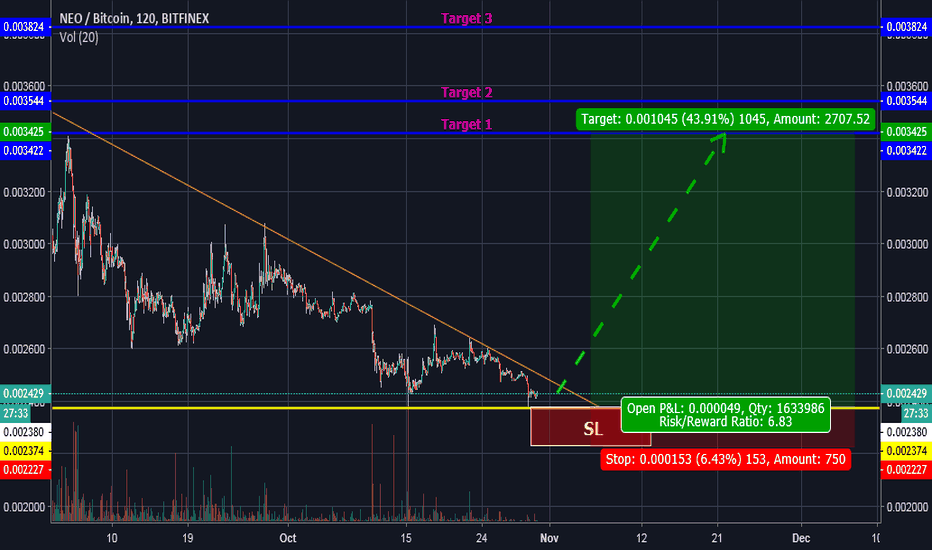
NEOBTC BUY IT NOW FOR UPTO 200% PROFITS IN COMING DAYSNEO BTC HAS BEEN CURRENTLY IN EXTREMELY CRITICAL LEVEL AND THE RSI SHOWS IT HAS BEEN OVERSOLD ,THUS THERE IS HUGE CHANCES FOR THIS COIN TO GET PUMPED IN COMING DAYS WITH YIELD OF MINIMUM OF 70-100% PROFITS. THE CURRENT 2355-2400 ZONE ARE BEST ZONES TO BUY NEO.
***************************************************************************************************************************************
TRADING STATS:-
BUY :- 2370-2415
FLASH SELL :- 2495
SHORT SELL :- 2616
MEDIUM SELL :- 2808
MID SELL :- 3232
HOLDER SELL :- 3636
STOP LOSS :- 2200
*************************************************************************************
HAVE A HAPPY TRADING TO ALL .
OUR LAST FULL TARGETS WAS HIT FOR DLT CALL, STEEM IS ALSO ABOVE 9% FROM OUR BUY ZONE NOW, AE &OAX ALL ARE GOING GREAT.
*********************************************************************************
FOLLOW ME FOR MORE UPDATES..
NAMASTE TO ALL !!!
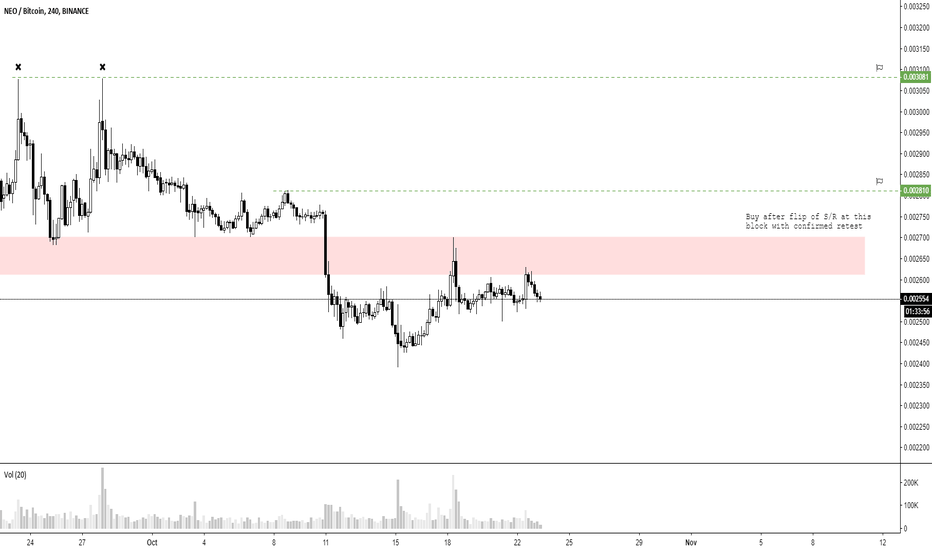
NEO/BTC approaching resistance. Watch for a move near 2340. NEO/BTC has formed a double bottom support around 2340 (0 fib level.) We saw the 2340 area form and hold back in August, and that acted as the springboard for its eventual move to 3400. This time around, we hit 2340 on a wick, and we are now approaching a possible resistance zone following that bounce. We can see that NEO/BTC has been in a downtrend for about 2 weeks, and has been unable to break above and sustain above the light-blue line on my RSI chart on the 4-hour. If NEO/BTC cannot get above (and hold above) the light-blue line on the RSI, and get above (and hold above) the orange line on my price action, then there is a possibility we could see NEO/BTC retest its bottom a third time. I suspect we will see a third retest of the bottom around 2340, as for we have overhead resistance from the previous-support-now-turned-resistance at 2440 and we have resistance from the 4-hour EMA's just above that. We can also see the RSI starting a possible curl to downside once more from my light-blue line. Should NEO/BTC be able to get above and hold above the light-blue line on the RSI and get above and hold above the orange line on the price action, we could see it move up to meet some of the 4-hour EMA's, and if it can above those, it could possibly run to the .236 fib level around 2600.
Area to watch for entry:
2330-2350 (0 fib level and we've seen this support hold twice so far.)
--This is not financial advice. Always do your own research and come to your own conclusions before buying/investing, as investing in cryptocurrencies comes with high risk and high amounts of volatility.
NEOBTC - Bankroll WizardryNEO - Digital asset smart contract platform aiming to bring together identity and asset management on the blockchain.
Disclaimer: NEO is one of my top picks the fundamentals are top notch and the ecosystem of Dapps being built on it are quality, i am very bullish on projects coming out of china especially ones that align with the interests of the chinese government. Take it as you will but cooperation with governments is key in my opinion for longevity and guaranteed use case
Chart speaks for itself we are the precipice of the 10 month downtrend one more weekly candle and we will be moving out of the diagonal resistance line. we have 2 very strong bases of support located at 23XX and 21XX at this stage the R/R is second to none.
MACD showing buy signals with the 12MA crossing the 26MA Histogram gives a green light and i dont tend to use the MACD often however given this period of sideways accumulation action this is a very bullish case for the beginning of an uptrend.
entered LONG on NEO at 24XX
Stops at 20XX
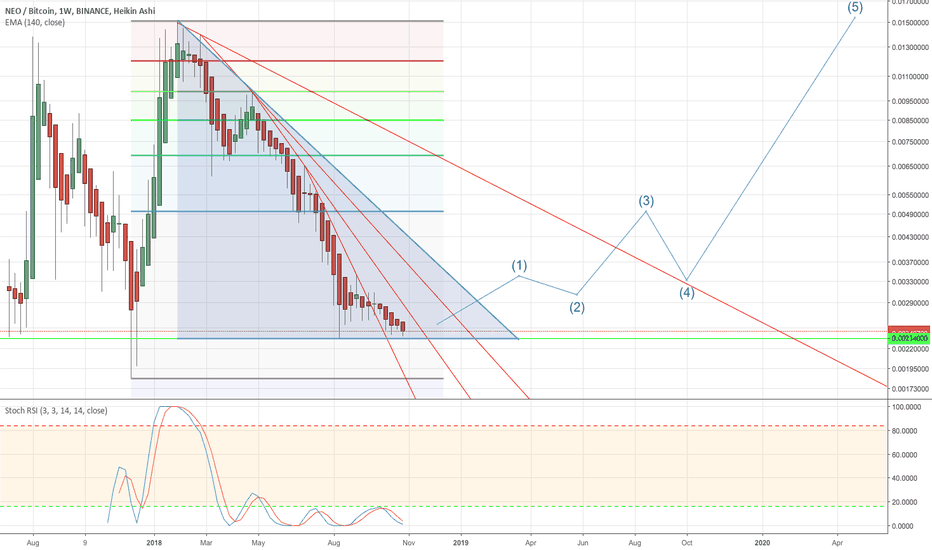
[NEOBTC] Good coin to buy-in deep now!Hey guys,
in this weekly chart you can see the NEO/BTC trading pair.
It's pretty much on it's bottom. Grounded on a very strong support line.
When the whole crypto market starts to take up volatility again, it will grow for sure
Our indicators are saying it's clearly oversold, this will equalize with a gain in it's price point for sure too.
Safe trade.
Likely to breakout when bitcoin begin's next uptrendI think NEO will continue to stay mostly flat, possibly dipping a bit lower, then breaking into an uptrend when bitcoin goes that direction. I wouldn't consider the 12345 wave to be accurate, more of a guess. so much could happen fundamentally between now and then that it's really not likely, but we'll see!
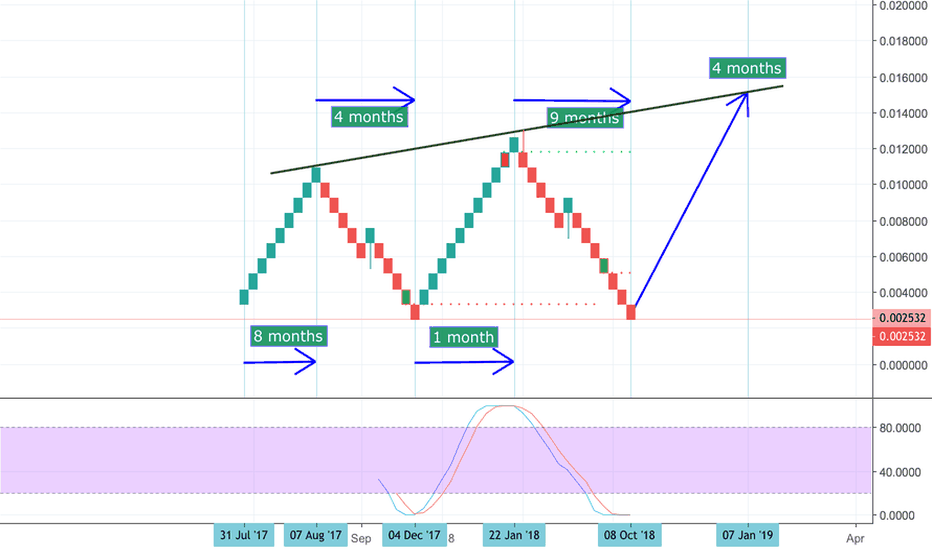
Neo, minimal risk, high profit (~40%)NEOBTC is accumulating at the bottom of my TA, if we go even lower than the current value we have to exit your trading quickly.
The risk is very low, because the 2400 Satoshi is a huge Support for NEOBTC for a longer time now. On the other side we have the potential to generate easily 40% from the current price. NEO has also huge potential for 2019.
beware, thats my personal Analysis. I´m not your financial advisor!
If you like my TA, give me a Thumbs up and like my profile to get my future analyse
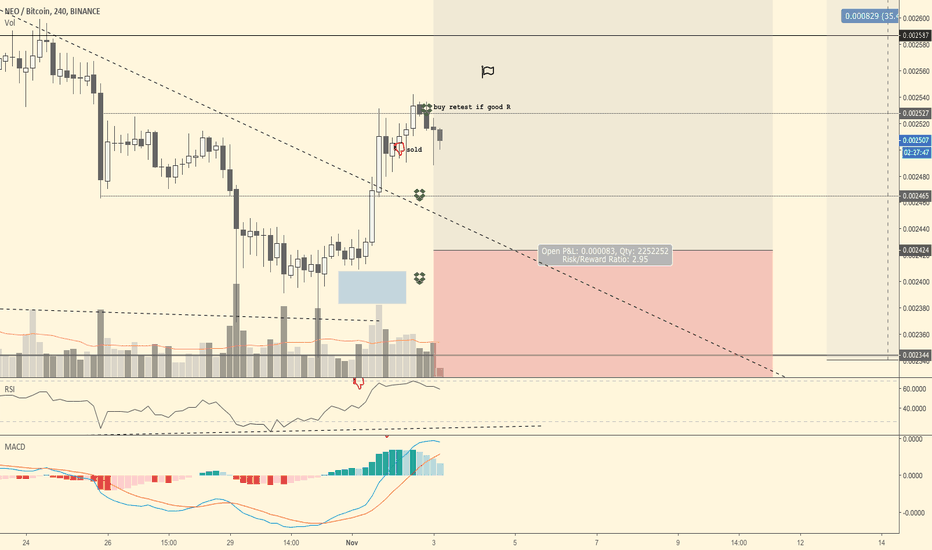
NEO/BTC small reversal coming?This current retracement lines up well with the fibs (just under .705), successfully tested 4H(red) and 1H(gray) bullish orderblocks for support, and seems like it wants to make some higher lows.
All somewhat good indications of a possible move upwards.
Next step would be breaking the yellow pivot line and establishing support on top of it beofre attempting to break further resistances.
Upon successful bullish momentum I'd expect the final target for this short term(few days/1-2 weeks) movement to reach that tiny gap that it has left unfilled around my TARGET area.
Of course I may be completely wrong which should be obvious if it breaks that previous low and keeps attacking the bullish orderblocks.
If you're looking to enter right now just keep proper risk management in mind and all will be well. A more conservative entry would be when it tests yellow level as support AFTER breaking it.
NEO/BTC small reversal coming?This current retracement lines up well with the fibs (just under .705), successfully tested 4H(red) and 1H(gray) bullish orderblocks for support, and seems like it wants to make some higher lows.
All somewhat good indications of a possible move upwards.
Next step would be breaking the yellow pivot line and establishing support on top of it before attempting to break further resistances.
Upon successful bullish momentum I'd expect the final target for this short-term(few days/1-2 weeks) movement to reach that tiny gap that it has left unfilled around my TARGET area.
Of course I may be completely wrong which should be obvious if it breaks that previous low and keeps attacking the bullish orderblocks.
If you're looking to enter right now just keep proper risk management in mind and all will be well. A more conservative entry would be when it tests yellow level as support AFTER breaking it.
Original idea by Svarog
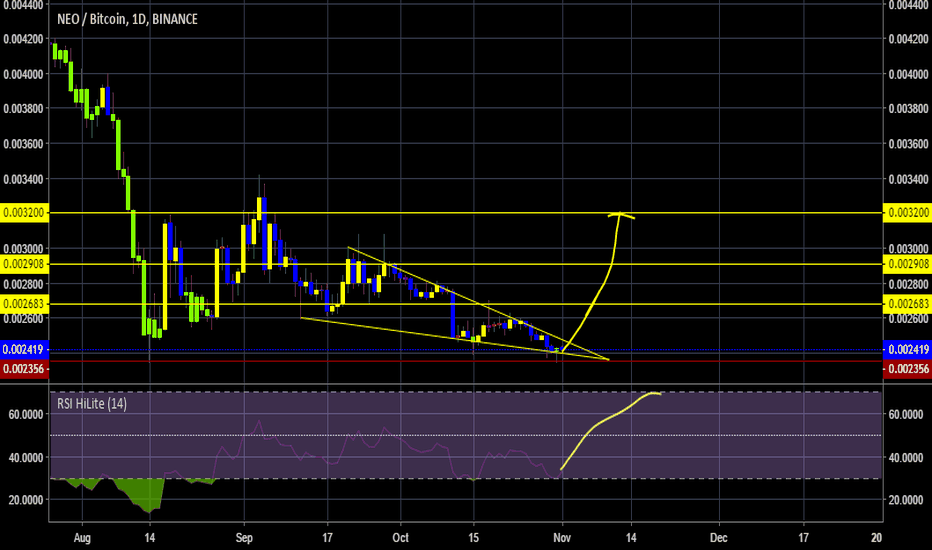
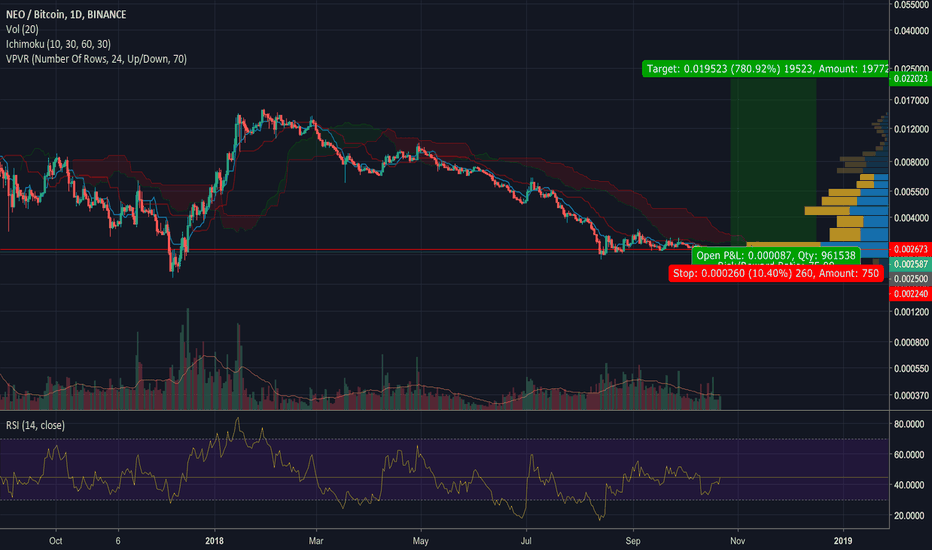
$NEO #NEOBTC Technical Analysis - Day Trader ExplainsHello Lads and ladies,
Today we will be looking at NEOBTC, requested by myself this time, since I saw this amazing opportunity on NEOBTC, I thought I have to let everyone know and follow it myself.
So to start off, today TA is not very hard to do and should be obvious from the second you look at it, therefore we will immediately start with it.
Looking at NEOBTC we see a big downtrend channel, respecting both downtrend resistance and downtrend support even with the exact angle. Now finally like many other coins NEOBTC has come down to its very bottom.
Nevertheless, we see that it is going extremely flat and confining its support very very clearly. Which in this case would mean that we have a strong support and the price is at this support.
Having this type of trade set up provides one with almost the BEST Risk Reward Ratio because the trade would be invalid if NEOBTC breaks its support, yet the losses compared to the possible earnings are very very small since the price is at the very bottom.
The NEOBTC chart here is even on the daily chart and seeing such a flat movement on the support means most of the time a big accumulation and then being followed by a very nice breakout and pump.
This increase in buying can also be seen while looking at the increasing RSI,yer really flat chart.
This once again means a bullish divergence with an increasing chance of a breakout.
Based on the pretty obvious TA above here is how I will make my own trade.
NEO/BTC Bitfinex
BUY 2570 - 2550 - 2525 - 2500 - 2495 - 2375
Targets 3369 - 4510 - 5722 - 6706 - 7904 - 8845
STOP LOSS CLOSE below 1800
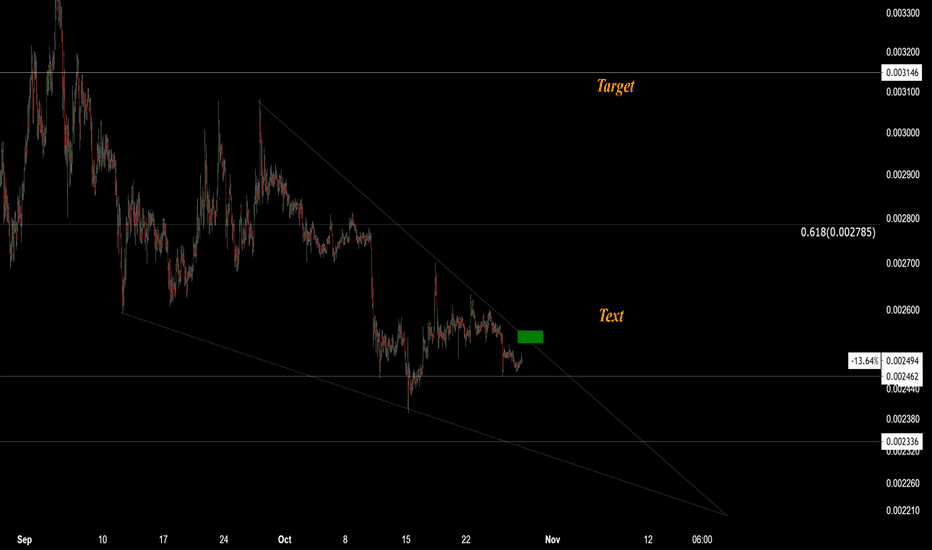
Weekly Analysis - NEO BTCHello guys I'm starting a weekly analysis on the top 10 marketcap cryptocurrencies, to stay updated and practice. Here is for NEOBTC.
NEO is looking like it is about to bottom out, so it might be a great buy opportunity for a swing trade.
However on the 4H chart we see a descending triangle which is a bearish sign.
Also for such a rally like in december 2017 to happen, I would like to see volume going up more than that.
So right now, I'd be patient untill we break out of this trangle, while keeping on eye on Volume.
That's all for today. I might update this idea in the next days so you should follow me if you don't want to miss it :p
Feel free to comment your opinion and thoughts !
-------------------------------------------------------------------------------------------------------------------------
My WebSite - Automated Strategies with Backtest and Alert Setup
Accepting commissions : TradingView pinescript development, reverse engineering
