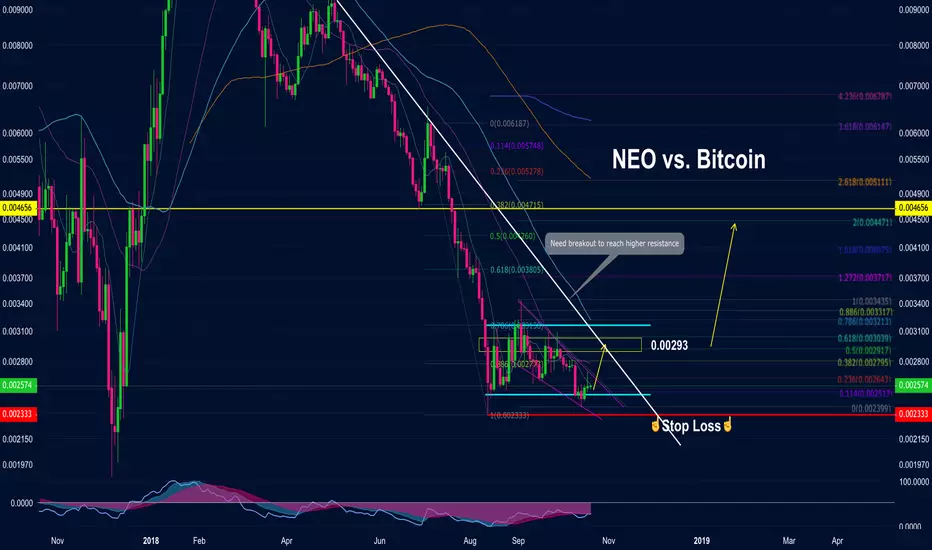
NEO vs. Bitcoin | Buy opportunity for Short and Middle TermsHello, good setup on NEOBTC showed up, so we can start buying in this channel zone
My target is 0.00293
Next step we need to reach bigger target is breakout from White resistance line
Stop loss on the screen
RSI looks OK
Moving Averages act like resistances
NEOBTC trade ideas

NEO a great buy right now.Can't determine a range of which NEO can top up in next month or two for a swing trade. What I can say is that it's insanely profitable to pick up some bags right now.
As stated on the chart, accumulation is obvious - and so is price suppression.
It means someone(s) missed out on the boat at the beggining and has taken advantage of the crash to surpress prices very obviously. This is bullish.
RSI bottomed out in virtually every time frame and most importantly on Daily & Weekly.
We broke a falling wedge to just accumulate.
Ichimoku cloud can't tell us anything as this pairing on Bitfinex is too new for the weekly.
Good luck.

NEO/BTC in ready Mode to BounceBased on technical analysis, NEO currently stuck in support area and accumulated. Possibility to fly was high. Its combined too with RSI that in bottom area.
Divergence also an indicator of the bounce area.
1st target area : 0.004673
Let see together

NEO BREWING UP FOR ANOTHER MASSIVE RIDENEO mostly referred to as the chinese ethereum is a rare gem with a potential 30x-50x at the peak of this current market cycle that is just starting.
In Jan 1 2017, NEO was just $0.14 on coinmarketcap.com, and by Jan 2018, NEO was priced at $157 ATH, that's a whooping 1000x plus return in just 12 months......are the days of 1000x truely over?....... Time will tell.
However, the 10 months downtrend of NEO seems to be ending (if it hasnt already ended) as the coin has been on a sideways move in the last two months after bottoming out 230 sat.
The two months consolidation seems to be getting stronger........,
MACD Squeezing out......
RSI below 45%.......
Price consolidating around the 1.0 fib retracement level
21 day EMA presently acting as resistance.
With little or no volatility in the market presently, the possibility of an uptrend beginning in the nearest term is very high.
However, i do expected a little retracement in price to cool off RSI completely before a move to the upside.
A long term HODL of this coin will be a great idea, especially because NEO has a great team that is very focused and purposeful in their quest to building a smart economy and also has a very active community.
A good entry will be within the box area 0.00248-0.00200 . Long Term targets should be at each fib level upwards

NEO, shall it be the Blue Pill or the Red Pill?Neo, the time has come for you to decide. Will you take the blue pill (happiness and security for all) or will you take the red pill (brutal truth).
The hour is upon us.
If NEO decides to take the blue pill then targets would be 0.0036 - 0.004 Btc.
On the other hand, if NEO takes the red pill then we stay in wonderland and I show you how deep the rabbit hole goes. (Not a profitable short trade)
Remember, All I'm offering is the truth and nothing more.
Now to the technical aspect of the chart:
We have been in accumulation phase for the best half of two months.
Since we are at such a stage, the downside seems to be very limited whereas the upside has much much more potential.
Fundamental Aspect:
Apparently there's a Super Fork on the 10th of November. This to me sounds like a great Fundamental setup since no one is talking about it yet.
Let me show you the consequences of both scenarios:
With the blue pill, we shall either skyrocket from here on out or we shall drop down one last time into the liquidity pool and take out most stops.
With the red pull, we creep lower and stay down.
The Risk to Reward ratio supports the long side (Blue Pill).
Also it is to be noted from my first NEO analysis, it has lost over 85% of its value as I predicted at every turn.
Now my play shall be to buy in 50% in the first green box and leave the other 50% for the slight chance of a stop hunt.
As Morpheus would say, “I'm trying to free your mind, NEO. But I can only show you the door. You're the one that has to walk through it”
________________________________________________________________________________________________________________________________________
I'm not your Financial Advisor and this is not to be construed as Financial Advice but I can be your Legal Advisor if you can afford me.

There is a possibility for the beginning of an uptrend in NEOBTCTechnical analysis:
. NEO/BITCOIN is in a range bound and the beginning of uptrend is expected.
. The price is below the 21-Day WEMA which acts as a dynamic resistance.
. The RSI is at 45.
. While the RSI downtrend is not broken, bearish wave in price would continue.
. The price downtrend in the daily chart is broken, so the probability of the resumption of an uptrend is increased.
Trading suggestion:
. There is a possibility of temporary retracement to suggested support zone (0.002600 to 0.002000). if so, traders can set orders based on Price Action and expect to reach short-term targets.
Beginning of entry zone (0.002600)
Ending of entry zone (0.002000)
Entry signal:
Signal to enter the market occurs when the price comes to " Buy zone " then forms one of the reversal patterns, whether " Bullish Engulfing ", " Hammer " or " Valley " in other words,
NO entry signal when the price comes to the zone BUT after any of the reversal patterns is formed in the zone.
To learn more about " Entry signal " and the special version of our " Price Action " strategy FOLLOW our lessons:
Take Profits:
TP1= @ 0.00329
TP2= @ 0.00364
TP3= @ 0.00470
TP4= @ 0.00560
TP5= @ 0.00640
TP6= @ 0.00740
TP7= @ 0.00963
TP8= @ 0.01110
TP9= @ 0.01200
TP10= @ 0.01400
TP11= @ 0.01520
TP12= Free

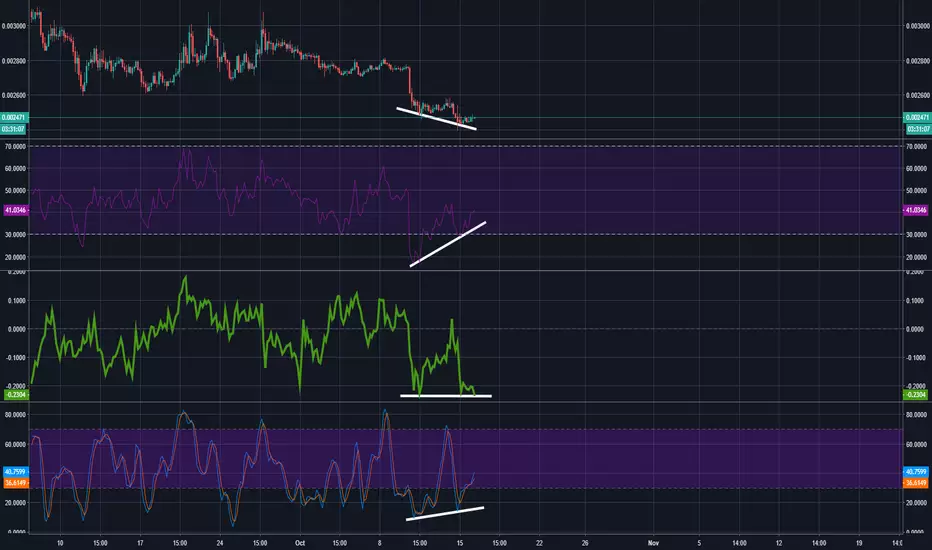
neo RSI divergenceThere positive RSI divergence on 2 hours chart.
stop loss level is under 2430
targets on the chart

Nice trade opportunity on NEO/BTCWe all know that the altcoin market is very oversold and it is only a question when the smart money gets in - if it didn´t already. Right now we can see a very good swing trade setup on Neo in pair with BTC (and USD as well).
Neo is currently sitting on a huge support, so we are trying to get into the trade now or somewhere in the orange zone of liquidity pool. If you buy now, there is a 1:9 RRR. The SL should be set on 0.00228. TPs are marked by green horizontal lines.
Anyway, even if SL is triggered, I don´t see this idea invalidated until we hit 0.00178. That is the point where the market is in serious trouble.
Size of the position should be rather small, this trade gives possibly really nice gains.
Please, don´t forget to like and follow if you like my ideas
Have fun!

NEO showing Bullish Divergence on the RSI and on the Stochastic.NEO/BTC is showing bullish divergence on the 4-hour RSI and the 4-hour Stochastic. CMF is also on a support it has tested 3 times prior, so it could start turning upwards as well. NEO/BTC came down to retest it's previous bottom around 2370-2390, and formed a tweaser bottom reversal pattern on the 1-hour chart, so we could be set to see higher moves. Good risk/reward on this play so long as Bitcoin can remain steady.
Entry: 2450-2475.
Target 1: 2550
Target 2: 2700
Target 3: 2800
(Tight) SL: 2380 (Right below the tweaser bottom reversal we formed on the 1-hour chart.)
(Loose) SL: 2330-2340 (Below the double bottom support.)
--This is not financial advice. Always do your own research and come to your own conclusions before buying/investing, as investing in cryptocurrencies comes with high risk and high amounts of volatility.
NEOBTC bottoming outSeems that NEO vs BTC pair has bottomed out.
I expect this one to rise significantly in the next couple days/weeks
big resistance above : 0.003050
above there it's 0.0044 and 0.0053
Above those we're homefree for higher
stay safe!

Exciting times Moment of truth - if support breaks there's one more and then just sadness.
Much like you miss the kiss of the woman you never met neo would like to feel again what it means to be alive.

NEO ready to fly.NEO seems that is back in the Matrix. Volume increase on rejection.
Clear Bullish divergences showing up. Once Price above the Hull MA (34) seems good chance to go long.


Good Chance for a NEO BounceNot heard anything about Neo since May, the hype dying down seems to match the price bleed.
Bought yesterday evening at 2473.
Trending histogram on the MACD, with the cross coming i think.
Stoch giving the bullish divergence (although only a slight price drop to accompany the increased buying momentum).
Expect a relief rally up to previous resistance at 2936.
Full profit at that mark, trailing stop-loss already in profit.
