NEO Ethereum of China getting ready to take off 2021The co-founders of Neo, and its predecessor Antshares, are Da Hongfei and Erik Zhang. Both serve as chairmen of the Neo Foundation, which aims to promote the blockchain’s adoption.
Erik Zhang was the author of the Delegated Byzantine Fault Tolerance algorithm, which aims to deter untrustworthy participants from taking part in the blockchain’s operation. This technology went on to be used in the Neo blockchain. He also served as the core developer for this network, and is playing an instrumental role in the development of Neo 3.0, the next iteration of the project’s infrastructure.
Rank #31
Coin
On 116,245 watchlists
Neo Price (NEO)
$37.07
12.39%
0.0007673 BTC
0.02074 ETH
NEOBTC trade ideas

NEO will flyYOUR LIKE OR COMMENT IS MY FUEL FOR NEXT ANALYSIS :)
This is not a financial advice. Always do your own research and always put stoploss in your trade (SL) :) If you want more detailed info how to study and read charts or just need help with some coin, just write to me here a comment, i will try to answer to everybody... i can help you :) all for free, don't worry, BE HAPPY!
If u like the analysis, please feel free to ask any question about this TA or crypto or any coin - leave a comment or like or share the idea, i really appreciate it because then my work makes sense :) thanks!

NEO / BTC SETUPNEO is currently testing resistance at the 200 SMA and forming a bullish ascending triangle. Breaking above the 200SMA has preceded huge gains in the past.
If BTC pumps, it will invalidate this idea. If it ranges, keep an eye on this and buy the breakout / retest!! Targets are marked at fib/support levels

Crypto|NEO/BTC|Long and shortLong and short NEO/BTC
Activation of the transaction only when the blue zone is fixed/broken.
Working out the support and resistance levels of the consolidation zone.
* Possible closing of a trade before reaching the take/stop zone. The author can close the deal for subjective reasons, this does not completely cancel the idea and is not a call to the same action, you can continue working out the idea according to your data, but without the support of the author.
The "forecast" tool is used for more noticeable display of % (for the place of the usual % scale) of the price change, I do not put the date and time of the transaction, only %.
The breakdown of the upper blue zone - long.
Breakdown of the lower blue zone - short.
Working out the stop when the price returns to the level after activation + fixing in the red zone.
Blue zones - activation zones.
Green zone - take zone.
Red zone - stop zone.
Orange arrows indicate the direction of the take.
Red arrows indicate the direction of the stop.
Priority - The value of the priority parameter implies the author's subjective opinion about the more likely activation zone on this idea, this does not mean that this idea will be 80% activated by this parameter, the purpose of the parameter is to provide for the risk of the inverse of the zone parameter.
Example: "Priority Long: So the author inclines more in the direction of the activation zone open long trades, in this case, when reaching the activation zone in short you should be very careful, because this area may be highly likely to be punched about the breakdown/do not get to take/activate transaction from go to stop."
Please consider this parameter if you use my ideas.
SUM PNL: This parameter displays the total % of all closed ideas of the "new" format (according to the author) for this sector at the time of publication of the idea. The calculation is very "clumsy" just the sum of the profits of all the ideas, based on this indicator, you can more accurately assess the risks when working with my ideas of this sector. I present you the construction of the idea, you can use it yourself as you like based on your subjective view and risks, the calculation of the PNL indicator is carried out only on transactions that the author closed on TV in manual mode or by take.
P.S Please use RM (risk management) and MM (money management) if you decide to use my ideas, there will always be unprofitable ideas, this will definitely happen, the goal of the system is that there will be more profitable ideas at a distance.

NEO on supportwill it be strong and go again to bull trend above the yellow? I guess so :)
not a financial advice tho)


Crypto|NEO/BTC|Long and shortLong and short NEO/BTC
Activation of the transaction only when the blue zone is fixed/broken.
Working support and resistance levels of the consolidation zone after growth.
* Possible closing of a trade before reaching the take/stop zone. The author can close the deal for subjective reasons, this does not completely cancel the idea and is not a call to the same action, you can continue working out the idea according to your data, but without the support of the author.
The "forecast" tool is used for more noticeable display of % (for the place of the usual % scale) of the price change, I do not put the date and time of the transaction, only %.
The breakdown of the upper blue zone - long.
Breakdown of the lower blue zone - short.
Working out the stop when the price returns to the level after activation + fixing in the red zone.
Blue zones - activation zones.
Green zone - take zone.
Red zone - stop zone.
Orange arrows indicate the direction of the take.
Red arrows indicate the direction of the stop.
Priority - The value of the priority parameter implies the author's subjective opinion about the more likely activation zone on this idea, this does not mean that this idea will be 80% activated by this parameter, the purpose of the parameter is to provide for the risk of the inverse of the zone parameter.
Example: "Priority Long: So the author inclines more in the direction of the activation zone open long trades, in this case, when reaching the activation zone in short you should be very careful, because this area may be highly likely to be punched about the breakdown/do not get to take/activate transaction from go to stop."
Please consider this parameter if you use my ideas.
P.S Please use RM (risk management) and MM (money management) if you decide to use my ideas, there will always be unprofitable ideas, this will definitely happen, the goal of the system is that there will be more profitable ideas at a distance.

NEO in rising wedge close to strong resistanceHello traders,
This is a little bit unusual analysis on my channel. I usually trade usd pairs, but this one is exception. NEOUSDT price is struggling despite fact that BTC.D is falling also BTC price is rising (atm). So i was looking for answer in NEOBTC. In chart we can see that NEO is in huge rising wedge, what is bearish signal. NEO is currently trading at 745 sat and we can see strong resistance at 775 sat. I marked 2 wide support zones below, where market was struggling to rise/fall.
I am a bit confused now, because NEO has strong fundamental news of releasing NEO 3.0 blockchain, which i explained in my previous NEO analysis. On the other hand, rising wedge is definitely bearish signal as consolidation after long market - If we look at 1D or 1W chart we can see that NEO is in bear market since september 2020, when H&S sent him down.
It is important to watch both upper and lower trendlines and how will NEO react there. In general - if NEO breaks lower tl, it may be breakout from falling wedge followed by huge drop. BUT, considering fact like NEO 3.0 strong fundament and falling BTC dominance i think NEO manage to break from this formation UP even it is not natural. Sometimes its better to trade with your logic and feeling, not with lines and charts like robot without soul. But this is just my personal idea not investment advice, always do your own research and decide on your own.
Please let me know in comments your opinions, would love to hear them.
I will appreciate like and follow
TRADE BITH BRAIN, NOT GREED

💡 NEO: BUY Trade 🚀🚀🚀🚀🚀🚀Neo has sharply started uptrend on weekly timeframe, bcoz of NEO 3.0 Mainnet launch upcoming event. it will easily hit my targets in upcoming weeks.
on smaller timeframe it correct please don't panic and sell, have patience and HOLD strong.

NEOBTC – Another bullflag? 🦐IF $NEO.X will have a breakout upward and flip the 4h resistance into new support, According to Plancton's strategy (check our Academy), we can set a nice order
–––––
Follow the Shrimp 🦐
Keep in mind.
🟣 Purple structure -> Monthly structure.
🔴 Red structure -> Weekly structure.
🔵 Blue structure -> Daily structure.
🟡 Yellow structure -> 4h structure.
⚫️ Black structure -> <4h structure.
Here is the Plancton0618 technical analysis, please comment below if you have any question.
The ENTRY in the market will be taken only if the condition of the Plancton0618 strategy will trigger.

NEO/BTC Bullish Wedge ReversalNEO/BTC is gaining some traction after bouncing from the lower trend line of the wedge. Surprisingly enough, this pair remains unscathed after today's bitcoin drop. This gives me confidence that we can see some more action soon.
The first resistance area to beat is R1, based at the last touch of the upper trend line. in case that area gets taken out, the next target should be the upper trend line. It's unclear where the price will touch the trend line, therefore I can't give a proper numerical target. Do your own DD.
Happy trading!

NEOBTC an expected breakout of cloudBig bullish Shark:
Previously we have seen that the NEO coin formed a big bullish Shark and produced more than 300% rally.
SMAs on the weekly chart.
Now on long-term weekly chart, the priceline of NEO coin with US Dollar pair has crossed up the all simple moving averages with the time period of 25, 50, 100 and, 200.
Up-channel:
On the weekly chart, with US Dollar pair the NEO coin is also moving in an up channel.
New Up-channel:
While moving in an up-channel on weekly chart, the priceline has also started more bullish up-channel within the previous channel.
Ichimoku cloud turned weak:
On the weekly chart, In the Bitcoin market the NEO coin is moving under the Ichimoku bearish cloud for a long time period. Now the bearish cloud has changed from strong to weak and it is possible that the price action of NEO will breakout this Ichimoku cloud resistance soon and start a powerful bull run.
Conclusion:
Even though the NEO coin is much bullish in the US dollar market. But after breaking out the Ichimoku cloud resistance it can turn very strong bullish in the Bitcoin market as well.
For exact buy and sell targets for this trade, and other harmonic trading signals you can join:
www.patreon.com


NEO Breaks EMA50, Prepare For a Strong Move Soon!NEOBTC is preparing to print a very strong move now that its price is trading above EMA50 for the first time in months.
We have the same view as before... Previous chart (10-Jan.)
We are seeing slow and steady growth...
Bullish consolidation before the next jump.
Namaste.

NEO break falling wedge !NEO/BTC breaks out of resistance after a long down trend since 2 months ago.
With this break out we can expect NEO/BTC to test the 1.618 fib level.
Retested new support (old resistance) and bounced off from there.
Bullish Indications:
👉Break out & Retest of resistance
👉Increasing Volume

NEO vs BTC - iH&SNEO v BTC chart to complement my earlier USD chart.
longed my longs on NEO.
iH&S
clean S/R flip helped establish another higher low.
1st meaningful resistance is at 870 sats, I'm betting it will be broken and flipped into support.


NEO Set To Change Trend (Next Target Mapped)All the classics signals are now in play for NEOBTC.
1) We have prices bouncing with increasing volume after hitting a new low.
2) Bullish divergence on bullish cross on the MACD:
3) RSI moving above 50.
4) Prices trading above EMA10.
These signals are very easy to spot and give up what will happen next... NEOBTC just hit a new low and is ready to reverse.
Namaste.

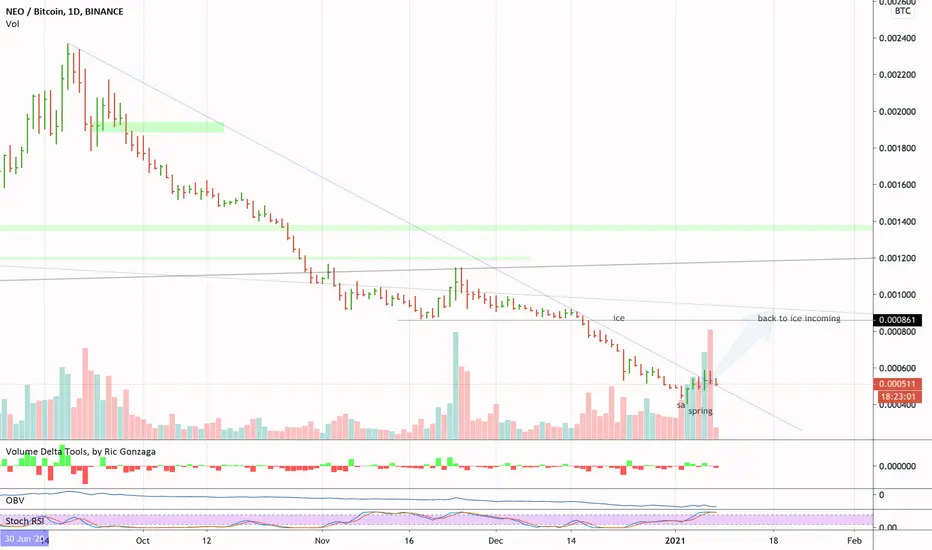
neo ready to money flowneo big chinese project, 1 of leaders of last cycle
ready to grow
big sell volume dont give result, weak progress, low spread