NEOBTC trade ideas

Buying NEO down here !!!NEO looks like a solid project to me and it is not going away.
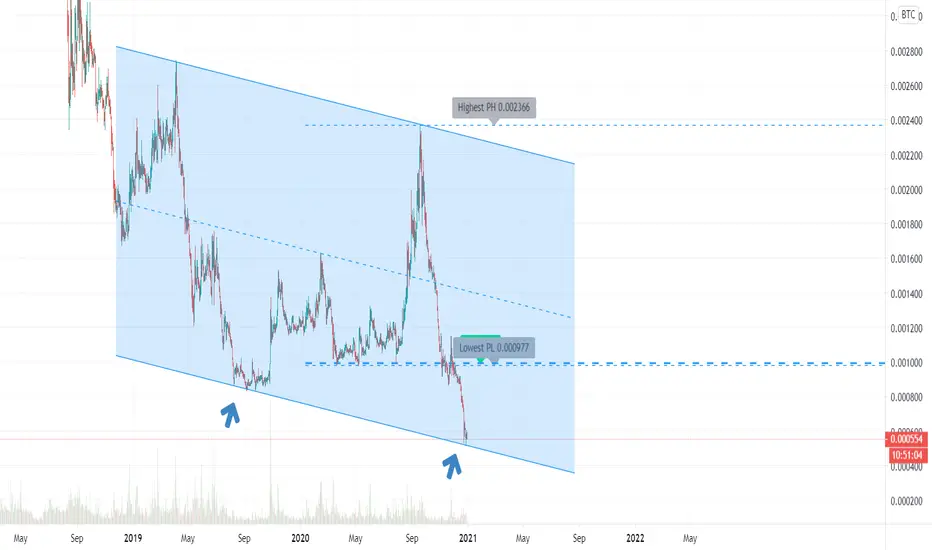
Actually it has lost about 96 - 97 % against Bitcoin from ATH to its recent low some days ago.
NEO has been one of the TOP performing ALT coins during the 2017 - 2018 bull run (going from 8 cents to 160 USD) - that's a 2000x !!!
Looking for cheap ALTs for the upcoming Altseason (whenever it will come) NEO looks like a very solid buy at 0.000587 btc !
There are some positive divergences and Neo looks really bombed out agains BTC.
I am a buyer at these levels.

NEO 3.0 - The biggest chance of a lifetimeWe believe NEO is one of the better cryptos out there. Marketability as the ETH from China is still existent.
So a few reasons why we are super bullish on NEO and believe this is the chance of a lifetime:
they are releasing NEO 3.0.
It is still the ETH from China and can be easily marketed as such.
an RSI Divergence in the bigger timeframe
NEOBTC hit the most bottom trendline
hit bottom of a possible triangle which in case it resolves bullish, would give incredible returns
we had an ichimoku cross on the Monthly chart on which we took support. This should drive us to at least 50$
Total Chart has made a higher high. Other cryptos are looking super bullish such as BCH and IOTA.
Not investment advice.

NEO/BTC LONGGGGGGGGGGGG$neo --> And there is our breakout at 0.000545 $sats
Current location : Earth
Destination : Mars


Crypto|NEO/BTC|Long and shortLong and short NEO/BTC
Activation of the transaction only when the blue zone is fixed/broken.
Working out the local support and resistance levels of the triangle.
The "forecast" tool is used for more noticeable display of % (for the place of the usual % scale) of the price change, I do not put the date and time of the transaction, only %.
The breakdown of the upper blue zone - long.
Breakdown of the lower blue zone - short.
Working out the stop when the price returns to the level after activation + fixing in the red zone.
Blue zones - activation zones.
Green zone - take zone.
Red zone - stop zone (S-SL short stop, L-SL long stop).
Orange arrows indicate the direction of the take.
Red arrows indicate the direction of the stop.

NEO - The Etherium of China or the formerly antsharesthere are hammer on BTC track.
let see the next following week.
this NEO is unique. coin can create coin.
just hold it, and you will get another coin.
like ontology.
current
rank 21
$20.52 USD (6.09%)
0.00106786 BTC (4.43%)

NEO possibility to Long!if this coin is still alive as I think, this sleeping giant can show its height very soon, Eth is waking up, LTc is waking up, Neo is on the turn!

Dust settling (Jan 1st 2021)NEO/BTC rates (January 1st 2021)
Just a potential idea for what a bitcoin exchange rate bounce could look like before going lower. Not certain!
Thanks for tuning in :) Disclaimer, anyone in the trade needs to do their own due diligence and decide what is right for YOU. My charts can be wrong at any time and it's very important that you have your own strategies and plans in place. I run this channel for my own educational purposes of learning to trade, and I will never be 100% right, so please do not let me confirm any bias for you! (Dangerous to do so, stay safe and remember the basics & rules of risk assessment.) Expect the unexpected and happy trading!


Looking at NEO - Keanu Reeves! NEOBTCAlligator can be seen to be 'waking up' indicative of a bullish move.
Broken out from a fallen wedge.
Strong double bottom.
BTC pair.


NEOBTC - Short-term play 4TPsIF NEOBTC breaks and holds 0.000991, I'll take positions.
Publishing for educational purposes. Warming up after a long break.

How To Trade EMA here i have set very good example on how you can trade EMA
it's common for every asset that it follow the price of EMA ( the moving average )
let's take example i set 7 ema on weekly chart so it's total 49 days moving average so if price make bounce above this ema on weekly something has been cooking in the asset . it's 49 days downtrend
same breakdown of EMA ( exponential moving average ) also shows upcoming correction in price on higher timeframe
so don't ignore moving average use this EMA with the triangle and other pattern and make your trading better
any asset always respect it moving average price if fall below major ema than it will take resistance if goes up than it will bounce when it touch EMA

NEO/BTCNEO/BTC pair is in a bullish channel that expect a retrace toward its trend line.
be careful of BTC pump and dumps...risky days we have...

NEOBTCHi guys,
You can see NEOBTC and important levels. Don't forget always it depends according to BTC.
Be safe and Good luck.

Here I go short on NEO and NEO will go downHere I go short on NEO and NEO will go down. The price is testing the major support, so now I go 5x short and the bearish breakout will start. And NEO will go down. See you down there
I'm already upadating the last shorts and they're playing out very well so far
Doge hit -20% so far
Qtum hit -20% so far
Ethereum Classic hit -20% so far
Bitcoin Cash hit -35% so far
Basic Attention Token hit -20% so far
Algorand hit -25% so far
Stellar Lumens is -5% so far
Always shorts against Bitcoin on Bitcoin pair so that we can profit while longing Bitcoin (I also shared a long on Bitcoin recently)
I always share a weekly chart. Manage the risks on lower time frames by using a resistance on lower time frames as reference and placing a target or walking stops down on lower time frames.
Happy trading

Could Neo be ready for a bounce?This pattern is almost perfectly symmetrical - it took 40 days to reach the top (140% rise) and now we are on day 79 for almost an 100% retracement (30% away from start of run).
There are a mix of signals here:
On the positive side we have
A bullish divergence with RSI into an oversold position.
Stoch & MACD looking ready to reverse
A Support (dotted purple line) in perfect inlinement with a FIB level.
Lowering volume on a decending trend shows less people selling.
On the negative side we have
Under all Exponential Moving Averages
Been weak the last 39 days
I would like to see a reversal price action signal.
If it is to bounce here - a target of 0.382 on a reverse Fibs where it is located now would be 30% (0.001715btc)

NEOBTC, The most clear entry point!If the price will approach the Support zone sharply we should look for an accurate Buy entry above it.
It falls a lot of time and the correction can be huge!
Push like if you think this is a useful idea!
Before to trade my ideas make your own analysis.
Thank you very much and thank you to the responsive commentators for their understanding.
I spend my personal time tracking the market situation and share my opinion openly with you.

