NEOBTC trade ideas

NEO - two potential paths to victoryI have a lot of love for NEO from the 2017 era and with NEO 3 coming in 2021, very bullish on this project.
Managed to pump even at a time that older projects were suffering, embraced DeFi and now exploring other areas including file storage.
Fundamentals are good and the project still has a lot of goodwill from the famous epic pump during the first rebrand.
So I think this one will soar when we finally get a legacy alts season. I think these are the 2 likely levels where we see a springboard up to these resistances.
I'll keep monitoring the chart and expect one of these paths to bear fruit.


NEO/BTC LONG NEOBTC formally, be in a downtrend, but recently bottoms have stopped updating, the graph shows how the downtrend line is clearly working out, you can make a purchase after breaking through and fixing above it, this scenario highlighted with a red line, we also have the main safety bucket below to repeat the bottom in the region of 850 sat for a coin. The closest targets will be 16xx sat and 23xxrade
POSITION trade
buy zone 1 - 10xx sat |after break|
buy zone 2 - 850sat |Bottom entry|
Target 1 - 16xx sat
Target 2 - 23xx sat
Target 3 - 46xx sat


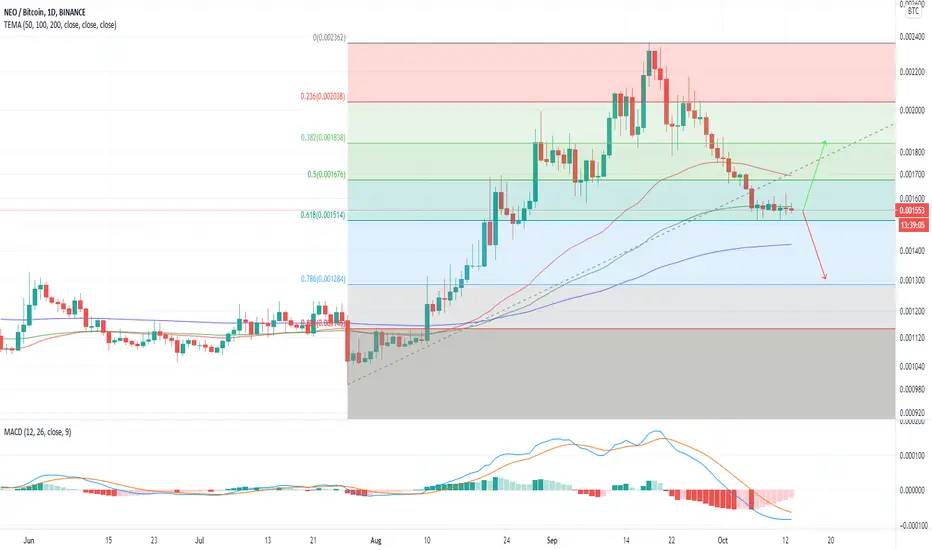
NEO/BTC (Daily Bear Flag?)💎Technical Analysis Summary💎
BINANCE: NEOBTC
-After a few days of consolidation within a small range
-NEO is starting to make a move again
-And the direction is going down
-This might be a potential Bear flag confirmation
-If the daily candle closes below its local support area
-The downside target is down to 1300s sat area
A big Thanks for donating 💰 via Tradingview coins this week to billstenzel 🙏🎉
``````````````````````````````````````````````
Trading Involves High Risk ⚠️
Not Financial Advice 💸
Please Exercise Risk Management 💱
``````````````````````````````````````````````
Thank You All!🙏😊💖For Supporting My Channel 📺
Through Leaving A Thumbs Up, Comment & Follow 💬
Happy Trading!😊💕💖
``````````````````````````````````````````````

618 Support?-618 of impulse move up
-confluence with hourly pivot S1
-Upticking histogram with potential Daily bullish macd cross
-R:R=6.45
Let's see how it plays out.
Remember: Keep it Simple, Manage Your Risk, & Don't get REKT!!
//Disclaimer: This is not financial advice.


NEOBTC looks badif we lose Fib 0.618 next stop Fib 0.786.
it must go upwords otherwise it'll affect weekly chart

fib div & macd & priceHello friends
Well, as you can see, the price in Fibonacci 38 has been resting for a day or two. Divergence can be seen in the MacD and the price. Everything is ready for a flight.


NEO/BTC Finally shows some powerBINANCE:NEOBTC had a very long downtrend during all bear-market. After researching about it today i found awesome signals about possible power actions.
Great volume and pattern to enter at a retrace near the golden line, very good for long-term portfolio

NEO is good to accumulate with strong fundamentalsNEO 3.0 Mainnet will be coming before the end of the year and you don't want to miss the uptrend.
With a retrace to the 0.618, the recommended way to trade NEO is to wait for a bounce and identify a MACD reversal (turning green)

NEO - When Will the Ole' Neo Bounce?NEO (formerly Antshares) is an open-source blockchain decentralized application platform, originally founded in 2014 by Da HongFei and Erik Zhang. They have since its rebranded to NEO from Antshares in 2017.
We saw our spike years ago, back when 0.015 BTC for an alt-coin was not a bad price, but definitely not as rare as it can be considered today.
After ages of trading sideways, we saw some action recently, hitting highs around 0.0020. Since then it's been a pretty sharp correction, with a clear downward resistance forming.
On smaller timeframes, it looks like we might get a little bounce. But with the low volume on the first support test, I feel like like we probably have a little further down to go.
MACD is majorly bearish and we've got a lot of room to go until we correct down to our notable EMA's
We're bouncing off an EMA level right now on the 4h chart, so may get a small correction up. But wouldn't bet on it right away.
Stoch is oversold, and has been for some time.
OVERALL THOUGHTS
Don't make a move right now, chances are we'll see a bump down before we're in solid buy territory. Area is marked on the chart as well as a potential TP.
TP - 0.0020700 +
Safest course of action is either buy the retest with a tight stoploss or wait until you have confirmation of a breakout from that downward resistance on the charts.
--
“...maybe sometimes it's riskier not to take a risk. Sometimes all you're guaranteeing is that things will stay the same.” -Danny Wallace, Yes Man
--
I'm a guy that you don't know posting his ideas on the internet for the sake of improving as a human being. If you take this as financial advice, that's on you.
If you like my analysis, then leave a like and feel free to follow for more free content. Feedback, criticism and crude humor are welcome :)


NEO approaching golden pocketPlease feel free to share your view on this pair down below in the comment section. I'm more than happy to be challenged and have an interaction on this idea.
Also make sure to leave a like as it helps me out a lot!
------------------------------------------------------------------------------------------
- 35% correction on NEO
- Golden pocket coïncides with 1500 support level
- MACD histogram is beginning to show weakness in the trend
I would wait for a confirmation of the 1500 level. With a tight SL at 1430 sats.
Target 1: 1650
Target 2: 1800
Two FIB levels that fall perfectly together with resistance levels
How do you feel about this trade?


$NEO - broken uptrend, resting on resistance to support flipNEO is currently resting after a strong bullish river abated. We need to see if this will hold as support in which case we might see a moderate leg up.
A lot of the recent uptrend appears to have been driven by the Flamingo Finance DeFi project. We could see a dump after people get what they need out of that project (honestly, not that familiar with it but need to look into it).
If that all goes well then it's worth keeping an eye on NEO as an emerging DeFi platform, it has cache with boomer traders who remember the glorious pump from 2017. I would love to see this run again!
