NEO Big Rise - Point ComparisonThis is a simple two point comparison between parts of the large bullrun and parts of the current bullrun
It can be seen that a massive move is missing as of current for us
This comparison can also be placed on LTCUSD which is another idea I will attach below, maybe a correlation between the two coins?
NEOUSD.P trade ideas


NEOUSD Elliott wave projectionAnalysis based on Elliott wave projection
Black lines are for exiting your positions gradually

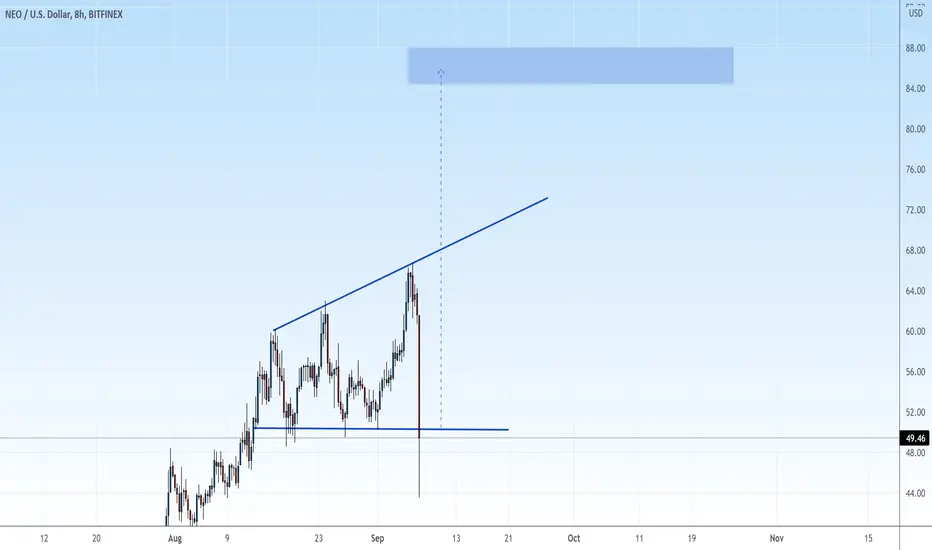
NEO ready for liftoff!NEO is breaking a big triangle formed since early 2021.
Breakout target is 170$ (+270%). Waiting for the daily candle close could confirm the breakout.


Wake up NEO and fly!!!Neo looks amazing. I like it!!!
Be ready on the blow of top of crypto market!!

MY NOT SO RENKO CHART FOR NEO$EOS (WITH INDICATORS)
11.01.21
1007H +8 SINGAPORE
THROWBACK THURSDAYS
ALERT: ENTRIES, PARTIAL EXITS, EXITS, and MAXIMIZED AREAS OF VALUE
THIS IS AN AREA OF OPPORTUNITY: A ZONE FOR AN ENTRY.
Dedicated to those who know the Rules of the RENKO and ICHIMOKU CLOUD.
I THIS IS A TRIAL ANALYSIS USING MY MINIMALIST ANALYSIS TO A RENKO
"FOLLOW THE WHITE RABBIT!"
Follow the TOPS and BOTTOMS of the BOXES.
HOW TO USE THIS MINIMALIST CHART
Created on a MONTHLY, WEEKLY & DAILY Analysis (The Dynamics of the Market.)
It is designed for SWING TRADES at the BOTTOM. I do not SHORT, though, you can still use it.
TARGET ZONES IDENTIFICATION
The LARGE BOXES (Tops and Bottoms) are MAJOR pivot points that will occur sometime in the future. While the SMALL BOXES (Tops and Bottoms) are MINOR pivot points.
These can be entries to a BUY/ SELL POSITION, EXIT/PARTIAL EXIT/TOP-UP AREAS
and if you wish to hold longer for a MAXIMUM TARGET EXIT AREA OF VALUE -CONSERVATIVE (If price action conditions are right.)
At times I include WAY BEYOND PARABOLIC Price TARGETS depending on The Character of the Market.
Watch out for your Volume, Chart Patterns, Candlestick Math, FIB COILS (ABC), Price Action, FIB LEVELS, Market Dynamics, and especially trading psychology.
Wishing you all The Best Trades and Thank you all for your Appreciation and Support of My Work.
Much thanks to My 3 Mentors!
Note:
Master your Trading Discipline
and Trader's Psychology
Vive Le Austist!

NEO's time will come...Just buy the dips, it may pull back to ~$40, and HODL even if it does dip some more... Sell when RSI peaks around 90 on the 1 year chart. Good luck

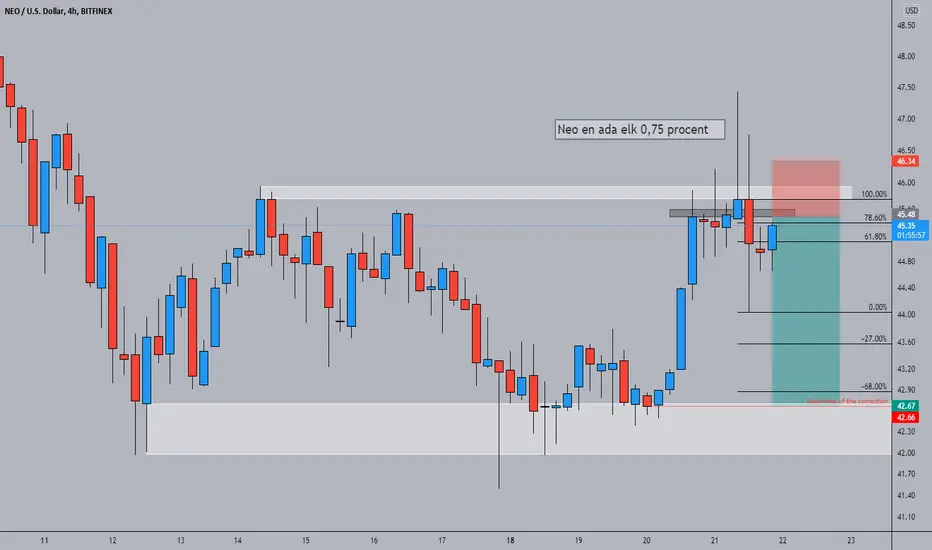
NEOUSD 22/10Weekly:
we are bearish
Key level got reached
Daily:
Bearish W
We are currently rejecting the daily zone with a nice wick and we have a bearish wick that indicates that price could get filled (daily candle didnt close but 4h is already bearish)
4H:
h&s
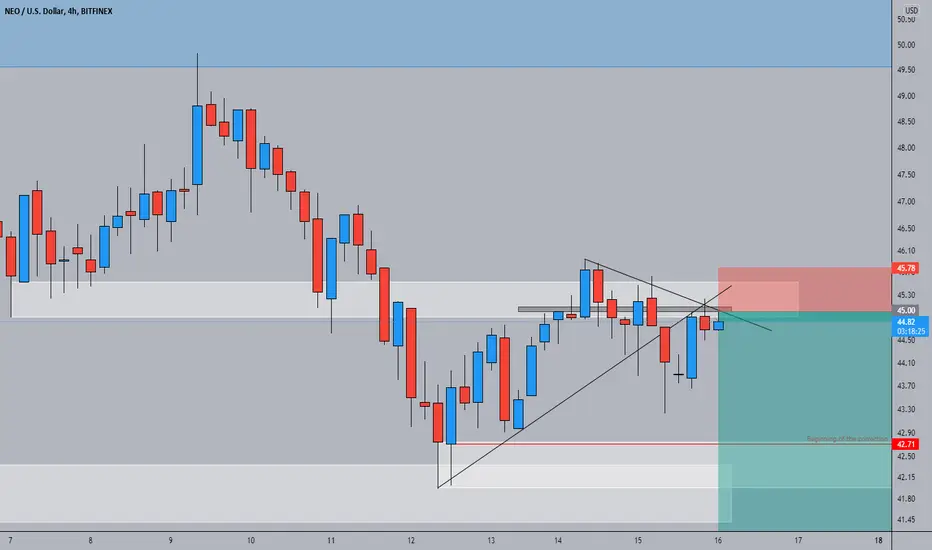
NEOUSDWeekly:
Retest level got hit
Daily:
Retest level got hit
Last daily close was a red candle with a wick, we expect the wick to get filled
4H:
Pattern in a pattern: h&s + bearish W.
We got a double trendline to protect our price
NEO (NEO) - October 13Hello?
Welcome, traders.
By "following", you can always get new information quickly.
Please also click "Like".
Have a nice day.
-------------------------------------
(NEOUSD 1W Chart) - Mid-Long-Term Perspective
Above the 23.66260578 point: the uptrend expected to continue
(1D chart)
I think the 23.66260578 point and the 37.84723159-50.22168635 section play an important role as the boundary between the uptrend and the downtrend.
If it rises in the 37.84723159-50.22168635 section, it is expected to create a new wave.
If it falls from the 23.66260578 point, there is a possibility of entering the mid- to long-term investment area, so careful trading is required.
------------------------------------------
(NEOBTC 1W Chart) - Mid-Long-Term Perspective
If the price is maintained above the 0.001672 point, it is expected to create a new wave.
(1D chart)
We need to see if we can sustain the price by moving up to the 0.000869-0.001010 segment.
If it goes down from the 0.000716 point, it could touch near the 0.000448 point, so you need to be careful with your trades.
------------------------------------------
We recommend that you trade with your average unit price.
This is because, if the price is below your average unit price, whether it is in an uptrend or in a downtrend, there is a high possibility that you will not be able to get a big profit due to the psychological burden.
The center of all trading starts with the average unit price at which you start trading.
If you ignore this, you may be trading in the wrong direction.
Therefore, it is important to find a way to lower the average unit price and adjust the proportion of the investment, ultimately allowing the funds corresponding to the profits to regenerate themselves.
------------------------------------------------------------ -----------------------------------------------------
** All indicators are lagging indicators.
Therefore, it is important to be aware that the indicator moves accordingly as price and volume move.
However, for the sake of convenience, we are talking in reverse for the interpretation of the indicator.
** The MRHAB-O and MRHAB-B indicators used in the chart are indicators of our channel that have not yet been released.
(Because it is not public, you can use this chart without any restrictions by sharing this chart and copying and pasting the indicators.)
** The wRSI_SR indicator is an indicator created by adding settings and options to the existing Stochastic RSI indicator.
Therefore, the interpretation is the same as the traditional Stochastic RSI indicator. (K, D line -> R, S line)
** The OBV indicator was re-created by applying a formula to the DepthHouse Trading indicator, an indicator disclosed by oh92. (Thanks for this.)
** Support or resistance is based on the closing price of the 1D chart.
** All descriptions are for reference only and do not guarantee a profit or loss in investment.
(Short-term Stop Loss can be said to be a point where profit and loss can be preserved or additional entry can be made through split trading. It is a short-term investment perspective.)


NEOUSDNEOUSD teacup pattern formation in weekly timeframe currently at the teacup handle with an inverted head and shoulder pattern at daily timeframe which my bias bullish.

Elliot 5 Wave Chart Pattern Chart shows the possibility of the Elliot 5 Wave Chart Pattern and it's target.

Cup And Handle Chart PatternChart shows the possibility of the Cup And Handle Chart Pattern and it's target.

Right Angled Ascending Broadening Wedge PatternChart shows the possibility of the Right Angled Ascending Broadening Wedge Pattern and its' target.

Double Bottom Chart Pattern - NEOUSDChart shows the possibility of the double bottom pattern and it's target.
Zoom-Out NEOUSD: It is still a buy & I am expecting a new ATHNEOUSD is still in a buy zone and monthly is just forming a reversal pattern. $20 may not come again. NIO will break its ATH

NEO/USD - what could potentially be expectedSimple idea. Note that I didn't keep the timing of the market in mind. This can develop over a longer time frame.
A wick below the uptrend to the lower 20s is still possible in order to provide liquidity. As long as it's a wick and the daily closes above the uptrend, this idea stays valid.

NEOUSDSL: 39.77
TP: 52.83
RRR: 2.04
Price is showing clear indication of respect to the 4hr trend and daily line of support, thus reflecting a potential rise in the market.

NEO long againTrying Neo trade again for round 2 since it's held the 50-51 area very nicely. Fingers crossed

NEO 2021/BTC 2017similar fractal pattern identified to the one bitcoin produced in the 2013-17 cycle!
If history rhymes, then the previous targets I posted are way lower than what we are going to see in the future
Idea inspired by trader: USCG_Vet
I hope you found it interesting:)
