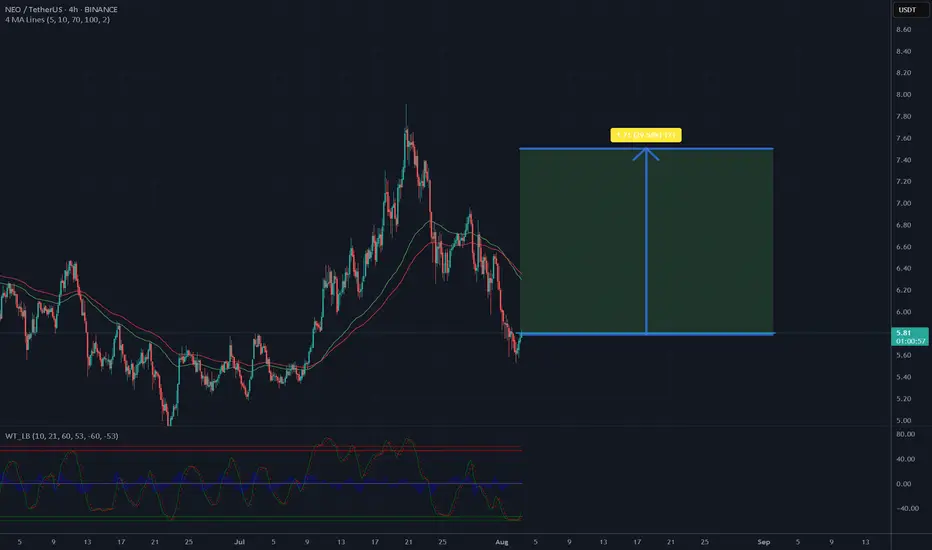
Is it a time for NEOUSDT? 30% potential profit - 7.50 USD targetThe chart shows a 4-hour candlestick pattern for NEO/USDT on Binance, covering mid-July to early August 2025. The price has recently declined from a peak near 8.81 USD to the current level of 5.76 USD, indicating a significant pullback. The moving averages (red and green lines) suggest a bearish trend with a crossover, but the price is approaching a support level around 5.5 USD. The oscillator at the bottom shows oversold conditions with a slight upward movement, hinting at a potential reversal. If buying volume increases and the support holds, a recovery to 7.50 USD appears achievable in the near term, aligning with the previous resistance zone.
Potential TP: 7.50 USD
NEOUSDT trade ideas
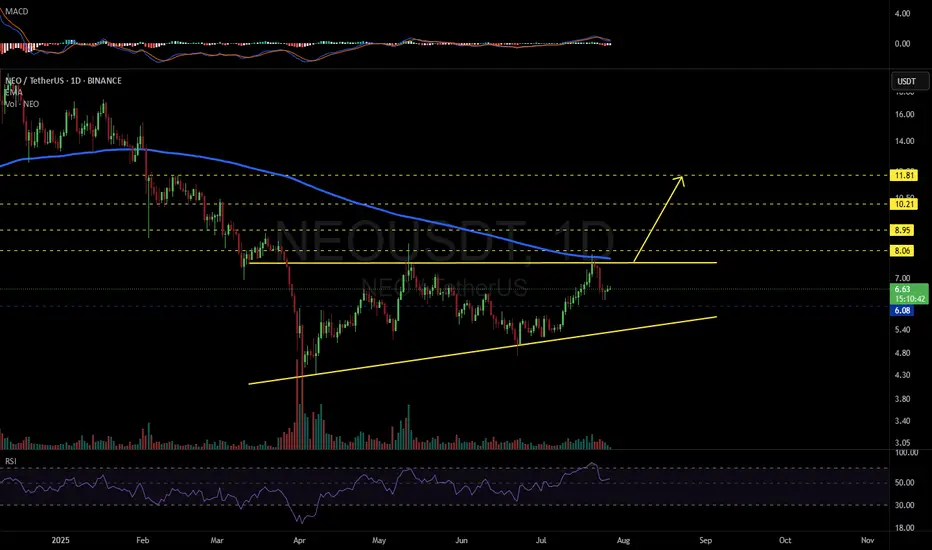
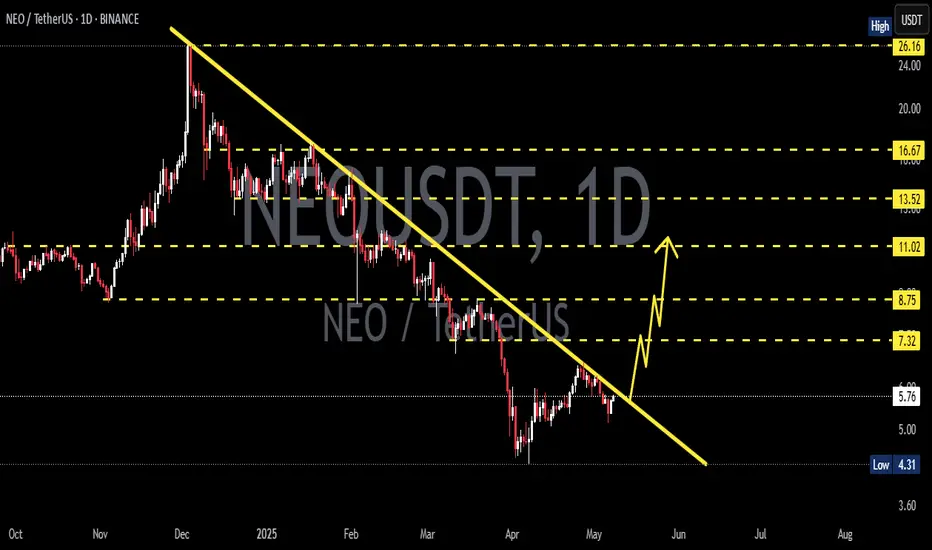
NEOUSDT 1D#NEO is moving inside an ascending triangle on the daily chart. Consider buying at the current price and near the support level at $6.08.
In case of a breakout above the triangle resistance and the daily EMA200, the targets are:
🎯 $8.06
🎯 $8.95
🎯 $10.21
🎯 $11.81
⚠️ As always, use a tight stop-loss and apply proper risk management.
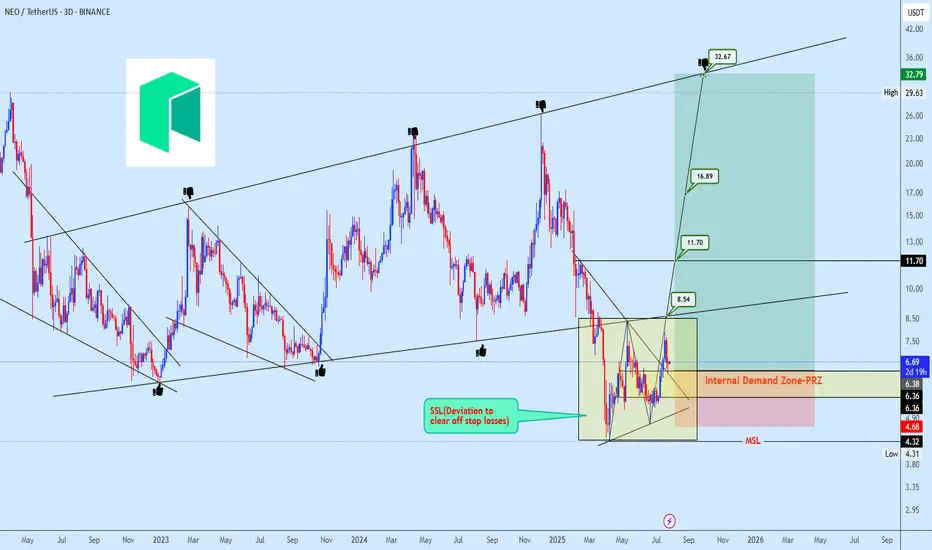
NEOUSDT Accumulation in Progress After Strategic Stop-Loss SweepNEOUSDT broke below its micro ascending broadening structure in what appears to be a strategic deviation to trigger stop-loss liquidity. Following this flush, price action has settled into a brief consolidation phase, often indicative of underlying bearish weakness losing momentum.
Our focus shifts to the internal demand zone, which is currently acting as a strong platform for accumulation. With price reclaiming the prior range low and reacting positively from the projected reversal zone (PRZ), we are positioning for a potential multi-leg bullish expansion.
Targets are projected at 8.54 → 11.70 → 16.89, with a final extension towards 32.67, aligning with the macro channel resistance.
Risk is clearly defined below 4.68, which serves as invalidation of this bullish view.
Is NEO the Most Undervalued L1 Left? Entries,Targets & FA Inside📌 Coin: NEO (Neo)
💰 Buy Levels:
✅ First Entry: $7.00
✅ Second Entry: $6.00
🛑 Panic / SL Level: $5.00
🧠 Fundamental Analysis (FA) – In Short
*️⃣ Sector: Layer 1 / Smart Contracts / Digital Identity
*️⃣ Use Case: NEO is a smart economy blockchain, designed to combine digital assets, identity, and smart contracts under one unified platform.
*️⃣ Tech: Built with delegated Byzantine Fault Tolerance (dBFT) consensus — fast finality, low energy, and supports multiple coding languages (C#, Java, Python).
*️⃣ Token System: Two-token model — NEO (governance) and GAS (fees). Holding NEO auto-generates GAS passively.
*️⃣ Narrative Fit: One of the OG Ethereum competitors, often called the "Ethereum of China" — positioning it well for East Asia Web3 narratives.
*️⃣ Unique Angle: Strong ties to Chinese developers and regulatory bodies; integrated into some government-facing blockchain pilots.
📊 Tokenomics & Market Data
(As of July 2025)
🪙 Current Price: ~$6.65
🧾 Market Cap: ~$470M
🔢 Rank: ~Top 100
🧮 Circulating Supply: ~70.5M NEO
🔒 Max Supply: 100M NEO
🔁 Token Distribution: Fixed supply, no inflation
🎁 Bonus: Generates GAS rewards passively for holders (staking-lite utility)
🎯 Bull Market Target (Realistic)
Target Range: $15 – $20
*️⃣ Based on prior cycle retrace zones, ecosystem relaunches, and renewed China Web3 engagement.
🚀 Mega Bullish Target (Speculative Top)
Target Range: $35 – $55+ $75
*️⃣ Would require full East Asia Web3 revival, new developer momentum, and speculation on legacy L1s with real governance systems.
✅ Final Take
🧠 NEO blends legacy reputation with clean tokenomics and unique East Asia exposure. While developer activity lags behind
we ask Allah reconcile and repay
NEO's Situation, A Comprehensive Analysis !!!The price on the 3-D timeframe is within an ascending triangle, which can be promising. If the price breaks this pattern with bullish candles, it could easily rise by the distance of AB=CD .
Best regards CobraVanguard.💚


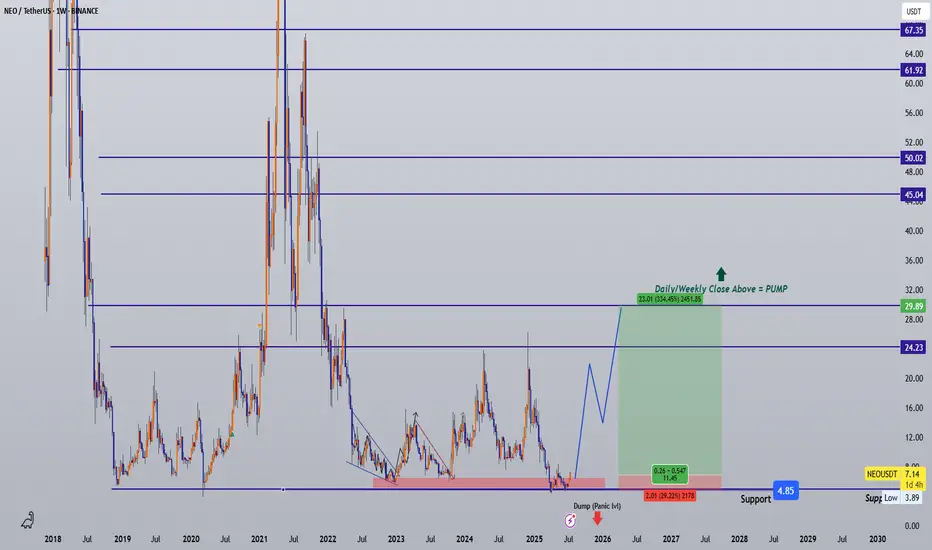
NEO/USDT – Strong Long-Term Accumulation Zone Detected!
🧾 Full Technical Breakdown (1W Timeframe):
NEO is currently revisiting a multi-year demand zone in the range of $3.90 – $4.50, a historically critical level where price has previously bounced before initiating massive rallies.
This zone has acted as a strong accumulation base during:
March 2020 crash
Mid-2019 correction
And now again in 2025 — making this the third test of the zone in a macro cycle.
The recent candlestick behavior shows price compression with long wicks, signaling demand absorption and the potential emergence of buyers.
📐 Key Pattern Formation:
Possible Double Bottom or Adam & Eve Reversal Pattern forming on the weekly chart.
Combined with horizontal support and psychological round number zone ($4–$5), this can be the foundation of a long-term trend reversal.
Price has entered a volatility contraction phase, which often precedes an impulsive breakout.
📈 Bullish Scenario:
If the support holds and we see a breakout with increasing volume:
1. Short-Term Targets:
$6.85 (local resistance)
$9.10 (previous consolidation block)
2. Mid-Term Targets:
$14.31 (last major breakdown level)
$21.54 (multi-month range resistance)
3. Long-Term Targets:
$29.38 – psychological level from previous cycle
$47.88 – historical supply zone
$62.48+ – potentially a multi-year bullish cycle if macro market turns risk-on
Watch for:
Bullish engulfing or hammer candle on the weekly
Breakout from descending structure with strong RSI divergence
Volume expansion above key resistances
📉 Bearish Scenario:
If the yellow support box fails:
Breakdown below $3.90 may signal continuation of macro downtrend.
Immediate bearish targets: $3.30 (2019 low), followed by price discovery below.
Invalidates the bullish reversal structure.
Could coincide with overall crypto market capitulation.
Risk Mitigation:
Use tight stop-loss below $3.90 if entering early
Scale into positions gradually (DCA) instead of full entries
🔥 Strategic Summary:
> “High-conviction zones are not found often — but this looks like one of them.”
With confluence of:
Historical demand zone
Psychological support
Pattern structure
Volume tapering near bottom
…this could be one of the last best accumulation zones for NEO if the market recovers over the next 6–12 months. A macro trend reversal could offer 4x–10x returns if history plays out once again.
📊 Resistance Levels to Watch:
$6.85
$9.10
$14.31
$21.54
$29.38
$47.88
$62.48
$115.28 (macro ATH level)
#NEOUSDT #NEOTechnicalAnalysis #CryptoReversal #BullishCrypto #NEOAccumulation #AltcoinBreakout #NEOPricePrediction #WeeklyCryptoAnalysis #SupportAndResistance #NEOChart #DoubleBottomPattern

#NEO is back at its historical demand zone!#NEO
The price is moving within a descending channel on the 1-hour frame, adhering well to it, and is on its way to breaking it strongly upwards and retesting it.
We have a bounce from the lower boundary of the descending channel, this support at 5.45.
We have a downtrend on the RSI indicator that is about to be broken and retested, supporting the upside.
There is a major support area in green at 5.30, which represents a strong basis for the upside.
Don't forget a simple thing: ease and capital.
When you reach the first target, save some money and then change your stop-loss order to an entry order.
For inquiries, please leave a comment.
We have a trend to hold above the 100 Moving Average.
Entry price: 5.55
First target: 5.63
Second target: 5.73
Third target: 5.86
Don't forget a simple thing: ease and capital.
When you reach your first target, save some money and then change your stop-loss order to an entry order.
For inquiries, please leave a comment.
Thank you.

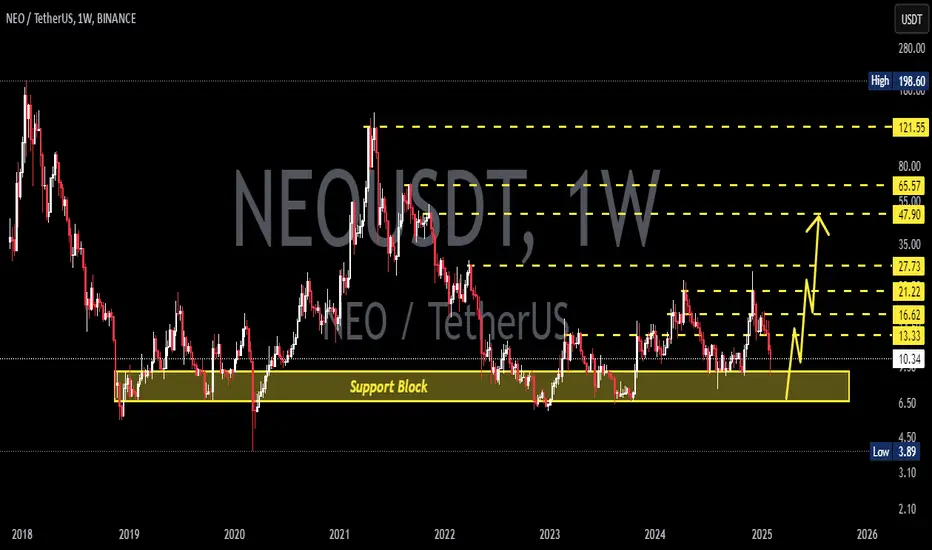
NEOUSDT 1W AnalysisNEO ~ 1W Analysis
#NEO This is the lowest support block for now. Buy gradually from here with a short term target of at least 20%+

Potential NEO 1H ScalpBITGET:NEOUSDT is currently testing resistance around $6.66 with RSI in overbought territory, which could trigger a short-term pullback.
A 0.5–0.618 retracement into the unmitigated hourly FVG ($6.39–$6.47) could provide a compelling long entry, while allowing an RSI reset and potentially forming an IH&S pattern.
The measured target for a breakout above ~$6.66 would be ~7.00 (still valid in case of a direct breakout without a pullback).
Setup 1
• Trigger: Pullback to $6.39–$6.47 and reversal
• Invalidation: Sustained break below $6.39
Setup 2
• Trigger: Break above $6.66 with volume
• Invalidation: Failure to hold $6.66 after breakout

AI-Powered Price Levels for NEO: Move7G6 lite StrategyDeveloped by @KwanZakCrypto, the Move7G6 lite model leverages artificial intelligence to generate precise price levels for NEO. Utilizing advanced pattern recognition, this strategy identifies key support and resistance zones to enhance trading decisions. Fully integrated into TradingView, it brings cutting-edge AI insights directly to your charts — blending innovation, accuracy, and trader experience.

NEO | Long | Pullback Buy Setup + Strong BTC OI | (May 21, 2025)NEO | Long | Pullback Buy Setup + Strong BTC OI | (May 21, 2025)
1️⃣ Quick Summary:
NEO is showing signs of potential upside, but a pullback would offer a much better long entry. With solid fundamentals and BTC open interest holding strong, I’m watching for a second leg long setup.
2️⃣ Trade Parameters:
Bias: Long
Entry Zone: Around $5.30 – waiting for a correction into this area
Stop Loss: Slightly below $5.00 to allow room for volatility
TP1: $6.52
TP2: $8.76
Final TP: $23.11 (long-term target with strong fundamental backing)
3️⃣ Key Notes:
✅ BTC open interest remains strong, and there's ongoing activity from institutional players—this could fuel upside movement.
✅ NEO is one of the OG Layer-1 chains, recently upgraded to N3, making it more scalable and developer-friendly.
✅ Watch out for market-wide volatility—if BTC dips hard, NEO might follow.
❌ If price never pulls back to $5.30 and just takes off, this setup is invalid. I won’t chase.
4️⃣ Follow-Up Plan:
If the pullback plays out, I’ll post a follow-up with updated levels and structure.
Please LIKE 👍, FOLLOW ✅, SHARE 🙌 and COMMENT ✍ if you enjoy this idea! Also share your ideas and charts in the comments section below! This is best way to keep it relevant, support us, keep the content here free and allow the idea to reach as many people as possible.
Disclaimer: This is not a financial advise. Always conduct your own research. This content may include enhancements made using AI.

NEOUSDT 1W AnalysisNEO ~ 1W Analysis
#NEO Buy gradually from here if you still have confidence in this coin with a short term target of at least 20%+.
NEOUSDT 1D AnalysisNEO ~ 1D Analysis
#NEO Buy after successfully breaking this resistance line with a short term target of at least 10%+ from here.

NEO/USDTKey Level Zone: 5.430 - 5.460
HMT v8 detected. The setup looks promising, supported by a previous upward/downward trend with increasing volume and momentum, presenting an excellent reward-to-risk opportunity.
HMT (High Momentum Trending):
HMT is based on trend, momentum, volume, and market structure across multiple timeframes. It highlights setups with strong potential for upward movement and higher rewards.
Whenever I spot a signal for my own trading, I’ll share it. Please note that conducting a comprehensive analysis on a single timeframe chart can be quite challenging and sometimes confusing. I appreciate your understanding of the effort involved.
Important Note :
Role of Key Levels:
- These zones are critical for analyzing price trends. If the key level zone holds, the price may continue trending in the expected direction. However, momentum may increase or decrease based on subsequent patterns.
- Breakouts: If the key level zone breaks, it signals a stop-out. For reversal traders, this presents an opportunity to consider switching direction, as the price often retests these zones, which may act as strong support-turned-resistance (or vice versa).
My Trading Rules
Risk Management
- Maximum risk per trade: 2.5%.
- Leverage: 5x.
Exit Strategy
Profit-Taking:
- Sell at least 70% on the 3rd wave up (LTF Wave 5).
- Typically, sell 50% during a high-volume spike.
- Adjust stop-loss to breakeven once the trade achieves a 1.5:1 reward-to-risk ratio.
- If the market shows signs of losing momentum or divergence, ill will exit at breakeven.
The market is highly dynamic and constantly changing. HMT signals and target profit (TP) levels are based on the current price and movement, but market conditions can shift instantly, so it is crucial to remain adaptable and follow the market's movement.
If you find this signal/analysis meaningful, kindly like and share it.
Thank you for your support~
Sharing this with love!
HMT v2.0:
- Major update to the Momentum indicator
- Reduced false signals from inaccurate momentum detection
- New screener with improved accuracy and fewer signals
HMT v3.0:
- Added liquidity factor to enhance trend continuation
- Improved potential for momentum-based plays
- Increased winning probability by reducing entries during peaks
HMT v3.1:
- Enhanced entry confirmation for improved reward-to-risk ratios
HMT v4.0:
- Incorporated buying and selling pressure in lower timeframes to enhance the probability of trending moves while optimizing entry timing and scaling
HMT v4.1:
- Enhanced take-profit (TP) target by incorporating market structure analysis
HMT v5 :
Date: 23/01/2025
- Refined wave analysis for trending conditions
- Incorporated lower timeframe (LTF) momentum to strengthen trend reliability
- Re-aligned and re-balanced entry conditions for improved accuracy
HMT v6 :
Date : 15/02/2025
- Integrated strong accumulation activity into in-depth wave analysis
HMT v7 :
Date : 20/03/2025
- Refined wave analysis along with accumulation and market sentiment
HMT v8 :
Date : 16/04/2025
- Fully restructured strategy logic

NEO/USDT: Strategic Short Opportunity at Key Resistance## Market Analysis
NEO has recently shown significant upward movement but is now encountering strong resistance at the $5.68 level. The price action exhibits classic signs of exhaustion with decreasing buying volume after a steep climb. The current 1-hour chart shows a potential reversal pattern forming, making this an optimal entry for a short position.
## Technical Indicators
- **RSI (Relative Strength Index)**: Currently in overbought territory at 79.28, signaling potential reversal
- **Volume Profile**: Declining buying pressure at current price levels
- **Market Sentiment**: Fear & Greed Index at 25 (Extreme Fear) - contrarian indicator supporting potential downside
- **Risk/Reward Assessment**: Favorable at 2.2 for the primary target
## Entry Strategy
Our algorithm identifies an ideal entry at $5.60, with consideration for slippage and fees. The NEO price has shown resistance to break above $5.68 with multiple rejections, strengthening our conviction for this short position.
## Risk Management
- **Stop Loss**: $5.74 (2.40% from entry)
- **Position Sizing**: Recommend risking no more than 2% of total capital
- **Exit Strategy**:
- Target 1: $5.38 (+3.89%) - Close 50% of position
- Target 2: $5.05 (+9.84%) - Close 30% of position
- Target 3: $4.75 (+15.11%) - Close remaining 20%
## Supporting Evidence
The recent price action shows a parabolic move that typically doesn't sustain. Additionally, the 1-hour chart displays potential bearish divergence between price and momentum indicators. Current ATR of 0.0841 (1.50%) suggests manageable volatility for this trade setup.
Remember to adhere strictly to the risk management rules outlined above. This setup offers an excellent risk-to-reward opportunity, but proper position sizing remains crucial for long-term trading success.

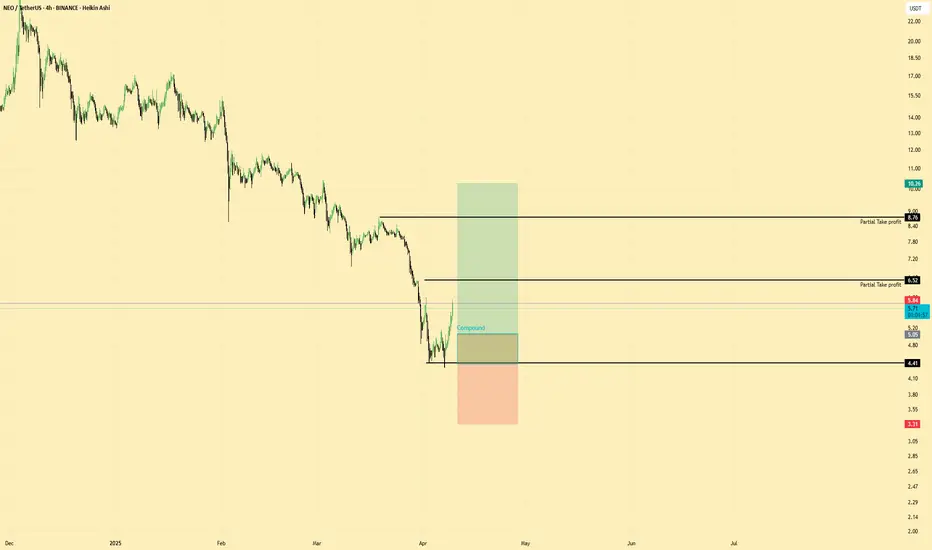
NEO | Long | Spot Demand Rebuild + Bullish Flow Shift |(April 9)NEO | Long | Spot Demand Rebuild + Bullish Flow Shift | (April 9, 2025)
1️⃣ Insight Summary:
NEO has been in a heavy downtrend, but signs of spot accumulation, buy signals, and momentum shift suggest bulls may be stepping in. I'm watching closely for a re-entry opportunity if price dips again.
2️⃣ Trade Parameters:
Bias: Long
Entry Zone: $5.00 – $4.40 (compound buy zone if price retraces)
Stop Loss: Below $4.40 (zone invalidation and liquidity flush)
TP1: $6.52
TP2: $8.76
Final TP: $10.26
Partial Exits: Around $6.50 and $9.00 to secure gains as we move higher
3️⃣ Key Notes:
✅ Strong buy signals have appeared after a deep selloff — paired with increasing volume and Money flow flipping bullish
✅ Money flow indicators are starting to turn positive, suggesting renewed interest in NEO
✅ NEO is often referred to as "China’s Ethereum" and has been building a next-gen blockchain platform focused on digital payments, identity, and asset tokenization
❌ Watch out for weakness below $4.40 — that breaks the current recovery structure
📈 This trade idea is based on both technical structure and on-chain/flow metrics
4️⃣ Follow-up Note:
I’ll look to re-enter if price dips into the compound zone. Will update this idea once price nears TP1 or if any major changes occur in market structure.
Please LIKE 👍, FOLLOW ✅, SHARE 🙌 and COMMENT ✍ if you enjoy this idea! Also share your ideas and charts in the comments section below! This is best way to keep it relevant, support us, keep the content here free and allow the idea to reach as many people as possible.
Disclaimer: This is not financial advice. Always conduct your own research. This content may include enhancements made using AI.
Trading opportunity for NEOUSDTBased on technical factors there is a Sell position in :
📊 NEOUSDT
🔴 Sell Now or by Breakout
🪫Stop loss 5.25
🔋Target 3.70
📏 R/R 2
💸RISK : 1%
We hope it is profitable for you ❤️
Please support our activity with your likes👍 and comments📝

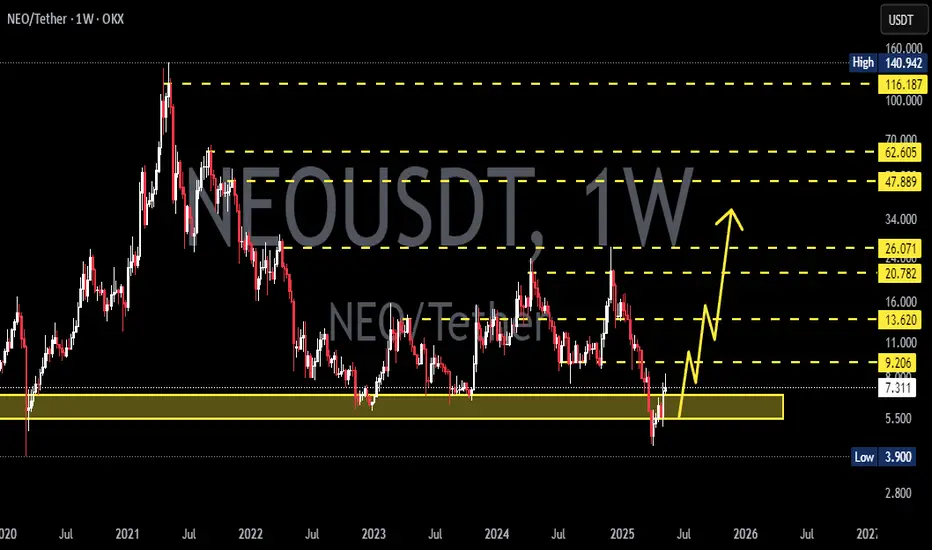
$NEO is back at its historical demand zone!NASDAQ:NEO is back at its historical demand zone 👇
Accumulated here for over 6 years — every bounce from this range led to massive rallies.
If it plays out again, $25–$45 isn't far-fetched.
Low risk, high reward? You decide.

NEOUSDT 1WNEO ~ 1W Analysis
#NEO Buy gradually from here with a short -term target of at least 20%+. This is the lowest support for now.

NEO is bearish (1D)The NEO structure is bearish. We have a support zone on the chart, and with this bearish structure, we expect the price to reach the demand zone.
The target is the same as the green box.
The closure of a daily candle above the invalidation level will invalidate this analysis.
Do not enter the position without capital management and stop setting
Comment if you have any questions
thank you

NEOUSDT 1WNEO ~ 1W Analysis
#NEO Buy from here if you still have a Conviction on this coin with a minimum target of 20%+