NEOUSDT- SETUPNEOUSDT similar situation we have a bearish impulse on the daily timeframe, after a impulse you expect the market to give you a correrction. We also have over sold conditions on the RSI i am expecting the market to make a correction and complete this daily M formation at the neckline before possibly seeing the continuation to the downside. For now what i am waiting to see on the 1hr timeframe is our entry rules to be satisfied for our harmonic strategy, if they are met we will be looking to capitalise on the corrective move and the market to go and complete the M formation at the neckline.
NEOUSDT trade ideas


Main Pullback Is in the wayAs You can see in my illustration as mine analyse of today about BINANCE:NEOUSDT there is a bunch of scenarios. But what I think is it's not important what was befor and what will happen is finishing a triangl when price drops to about 55 USDT and then it starts to going up. If what I think works well in the newest updates I could calculate the TP target level.
So stay up tuned by following this channel to recieve the most accurate analyse in the cryptos.
If you have some questions, please let me now.
Thanks for your attention.
Best regards.

NEO/USDT Closing a flag pattern above the 50$ support lineNEO consolidates above the 50$ line into a flag pattern.
We expect a breakout within the next week with the first target at 80$.
Volume dropped with the drop of NEO and did not reach previous heights.
This either results into a sharp breakout or a further consolidation phase.
Basic rules:
- Never buy the top/ATH
- Take profit as long as you can (also partial profit is profit)
- Use Stop/loss for leveraged positions
- If you are not experienced, don't leverage in the first place
Enjoy the ride and don't be too greedy.
If you like the content, please like, comment and give this channel a follow.
We would love it if you could share your thoughts in the comments.
Discussions are very welcome here.
Always do your own research and keep in mind that my charts and comments cannot be considered financial advice.
Cheers
ps.
Chart explanation:
Main lines:
- Green lines are tested support lines.
- Orange lines are resistance lines or, if we are above, possible support lines which were not tested yet.
- Cyan line is for volume trendline.
- White lines are Fibonacci retracement levels
Helplines:
- Purple lines are trendlines we take a look at.
- Yellow lines are for visual help only.
Boxes:
- Either entry zone or support zone. Check the description.

🔥 NEO Triangle Break Out NEO has formed a nice triangle pattern over the last few weeks. With BTC showing bullish behavior currently, we might see a nice break out of the pattern soon. be aware that BTC is currently trading near a strong area of resistance, so if BTC reverses from there it will take the market down with is.
For NEO, consider the $63 as a major hurdle to take before a stronger upward trend can commence.
Happy trading!

A little corrective movement is up commingAs in my opinion as a trader who believe to Elliot waves, I need to see clearly a corrective 3 waves after any impulse wave. So after a impulsive movement from 36 USDT to 66 USDT, there is not any corrective wave. An impulse from 66 to 47 USDT cant correcte the latest movement. So another movement from 47 to 62 USDT is clearly corrective like I expected. And now we need a 5 waves impulse to going down to complete our impulse from 36 to 66 USDT. So if the final wave goes just 61,8 % of A wave, it will reach the 50.132 USDT. It is just the minimum movement possible. it could be even more and now it's very soon to say it.
So don't scare if the chart shows something different of what you think. it's just some breathing befor going up.
If you have some questions or comments please let me know.
Best regards.

Flag pattern !A flag pattern, in technical analysis, is a price chart characterized by a sharp countertrend (the flag) succeeding a short-lived trend (the flag pole). ... Flag patterns signify trend reversals or breakouts after a period of consolidation.

NEO COIN SHORT OR SELL TARGET $20-22NEO after breaking the double bottom at the top with the severe decline of Bitcoin for me not only
Bitcoin is weak but altcoins are in the same weakness, here I nominate NEO as an Altcoin that is showing
signs of weakness where a loss of $48-$50 could lead to another serious plunge that drags it down to the
$20 region. In case you are not a leverage trader be careful if you buy, i guess we will be
buying a lot cheaper than now, good luck.


NEO Up or DownWe could break the triangle either direction at this point. Volume seems relative, no real revelations there. MacD is about to get a crossover on the daily which could lend to the more bullish perspective here at least for the short term.
Many coins are in this pattern and in general most look like a bearish pennant. But when looking from weekly perspective things looks more bullish. My main question is WHO WILL BE BUYING? In the US people have already used up their stimulus checks, and many people were burnt by the big drop recently. I can't imagine that many retail investors have been sitting on the sidelines waiting for this pullback, since most newbies FOMO in at the top just like the institutions like.
Curious to hear any input anyone has about where the new buyers will come from.
👇👇👇👇Join the discussion👇👇👇👇

Breakout DowntrendThe Trend Line Breakout technique helps you time your entry in a trending market. You can use a Trend Line to trail your stop loss and ride massive trends. If a Trend Line breaks, wait for the re-test and see if it holds. If it does, the market is likely to reverse in the opposite direction.
A broken trendline is a technical signal that can suggest a change in trend is at hand. If low volume ( rather than high volume ) accompanies the break of a trendline, the signal is not as strong or convincing. It can make sense to wait a day or two to make sure that the trendline break is legitimate.


NEOUSDTHello to you all. Mars Signals team wishes you high profits at all times.
The price has been able to break its resistance line and is fluctuating. We have drawn a channel line for you that can move from any side of the price. We have identified the area of support and resistance for you.
Warning: This is just a suggestion to you and we do not guarantee profits.
Wish you luck!


Another bulish move just startedPrice drop from 141 USDT to 35, was a little bit tragic and I believe there is a lot of people who looking to the charts for finding their hope of another big bullish movement. But I ask of my self is there any corrective movement with just one wave? I prefer to answer to this question like this. Is there any impulsive wave without corrective wave? No. So the earliest price drop from 141 to 35 USDT is not finished. But the bottom of that Wave is a historic point and it will maybe never come back again. So the first phase of corrective wave is finished and the for the second phase, we can set up our strategy for going up at least to 61.8% of the first phase. So I mean another bullish move with a implusive wave is started and it will reaches at least about 100 USDT. Look at the chart.
If you are interested to this chart and its probable profitable opportunities, leave me a comment and in this way I will analyse it more for new updates. In the same way if you are confused with my analyse, please ask me to explain in other way.
Thanks for reading and attention.
Best regards.
BINANCE:NEOUSDT

NEO/USD - 93% setupHello, Traders!
NEO is out of the active trading range of $40.00 - $54.80. At the moment there is a retest of the downtrend.
The analysis of the cumulative delta shows the presence of interest of buyers.
Buy entry can be looked for in the range of $51.00 - $56.00
Stop-loss can be placed under $42.00
Downside correction targets
$76,00
$88,00
$106,00
Good luck and watch out for the market
P.S. This is an educational analysis that shall not be considered a financial advice

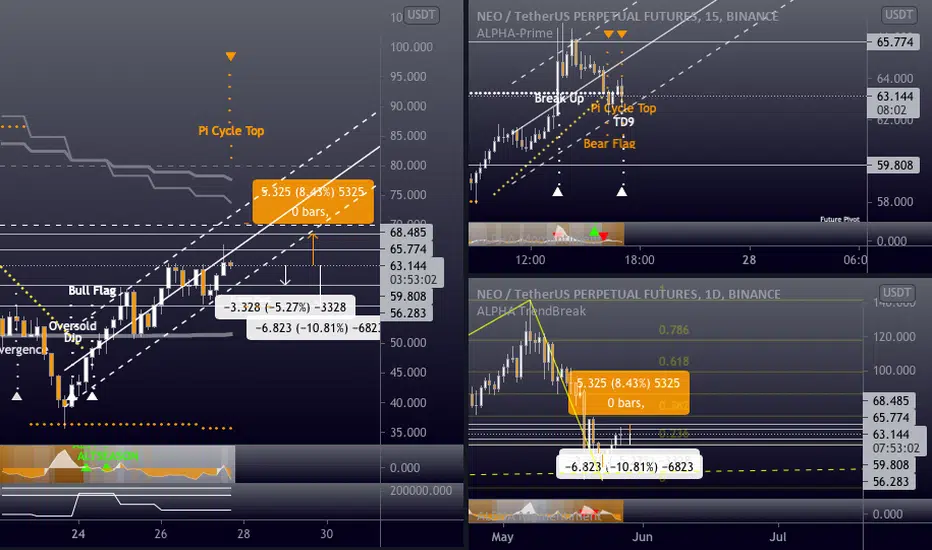
NEOUSDT - Short - Potential 10.81%NEOUSDT - Short - Potential 10.81%
Exchanges: Binance Futures
Signal Type: Regular (Short)
Leverage: Isolated (1X)
Entry Zone:
62.677 - 65.774
Take-Profit Targets:
1) 59.808
2) 56.283
Stop Targets:
1) 68.485
Trailing Configuration:
Entry: Percentage (0.0%)
Newest View for NEOWe still have NEO 3.0 on the verge, but obviously we broke some critical support recently. Given that we spent years in the $6 to $18 range I don't see this coin going back there ever, unless of course they fail. In the short term I see this retesting the trend line after a couple of up and down moves creating a triangle patter on the bigger picture. From there we will need to assess if that breaks down or up.
👇👇👇👇Join the discussion👇👇👇👇

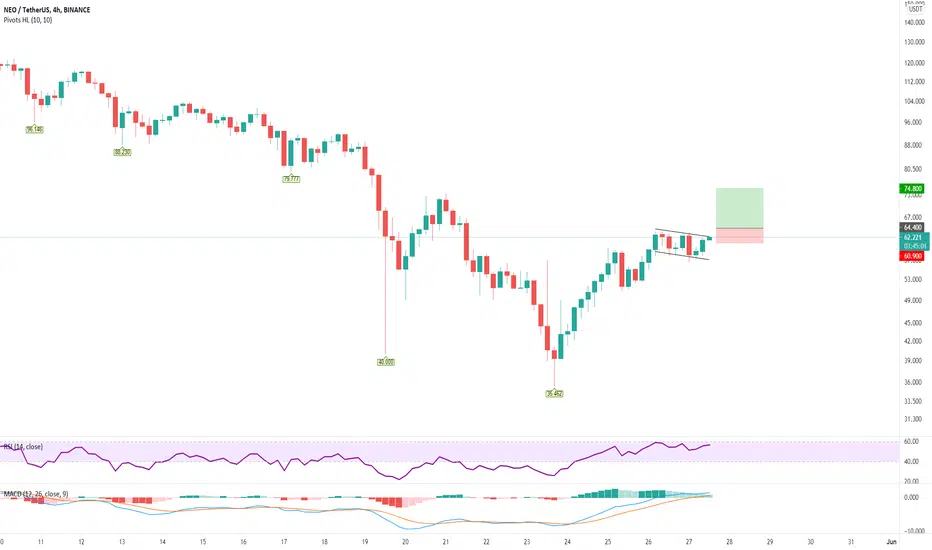
NEO Buy a break setup.NEOUSDT - Intraday - We look to Buy a break of 64.4 (stop at 60.9)
Posted a bullish Flag formation.
A break of 64.0 is needed to confirm the outlook.
Short term momentum is bullish.
The bias is to break to the upside.
We look for gains to be extended today.
Our profit targets will be 74.8 and 78.8
Resistance: 64.0 / 72.0 / 75.0
Support: 58.0 / 52.0 / 47.0

NEOUSDT longRisk warning, disclaimer: the above is a personal market judgment based on published information and historical chart data on Tradingview, all analysis is only subjective. Hope investors consider, I am not responsible for your investment decision. Thank you.
Good luck!

NEOUSDT neutralRisk warning, disclaimer: the above is a personal market judgment based on published information and historical chart data on Tradingview, all analysis is only subjective. Hope investors consider, I am not responsible for your investment decision. Thank you.
Good luck!

NEOUSDT neutral Risk warning, disclaimer: the above is a personal market judgment based on published information and historical chart data on Tradingview, all analysis is only subjective. Hope investors consider, I am not responsible for your investment decision. Thank you.
Good luck!
