after clv or clover this is my next break out pic_ short termclover is going for that final December dot Para-chain spot and from the pump id say chances looking good to decent... my next short term pic for a pump is Nexo and the news beginning to drop there. please keep in mind the market is poised to dump hard n on a razor edge on direction we go, just be ready to move really really quick.
NEXOUSDT trade ideas
Possible path? Hi All,
Just putting this out there for tracking purpose.
What do you think?
Possible?
Thnx
jad
I will buy mote NEXO in that areaAfter a healthy correction, I prepare to buy mote NEXO in that area

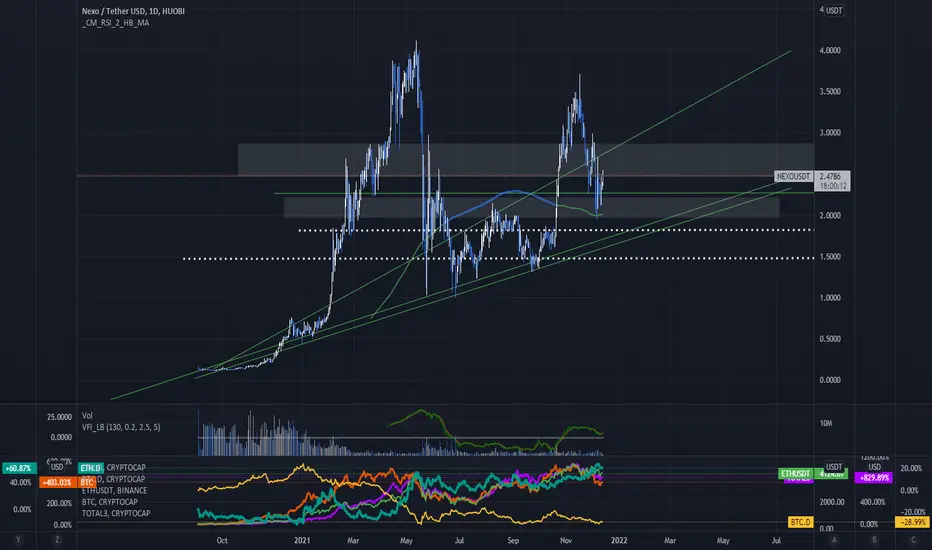
3 Things to Watch before Calling a NEXO BottomNEXO has been pulling back after it reached a 6-month high, but for the bulls to gain control of the market again, you need to watch for these 3 things:
1. Wait for the Stochastic RSI indicator to bounce from oversold readings.
2. The price needs to stay above the 200-day simple moving average.
3. The RSI needs to cross above the mid-level 50.
200-Day Simple Moving Average
NEXO’s price needs to stay above the 200-day simple moving average. The 200-day SMA also aligns perfectly with the big round number of $2.00, which provides more confluence.
RSI Oscillator
Another factor to consider before calling a bottom is to wait for the RSI to cross above the mid-level 50. A crossing above the 50 level would signal the return of bullish momentum and subsequently the end of the pullback.
Stochastic RSI Indicator
Lastly, traders need to wait for the stochastic RSI crossover before calling a bottom; the fast stochastic needs to cross above the slow stochastic. Additionally, it’s better to wait for the stochastic RSI to bounce up from oversold readings. This will ensure again that NEXO is ready to climb higher.

NEXO: next 3-4 months.Check the nice Schiff channel on this one.
Great platform/app, great interests, great credit line.
I dont think this one will fail long term tbh.
Its seems to be acumulating now.
Hopefully, preparing for higher flights.

Just a token i holdHi All,
Just a ETH TOKEN I hold on NEXO platform.
What do you think?
Will it catch up the Bitcoin pump?
Thnx
Jad

NEXOUSDT Daily TimeframeSNIPER STRATEGY (new version)
It works ALMOST ON ANY CHART.
It produces Weak, Medium and Strong signals based on consisting elements.
NOT ALL TARGETS CAN BE ACHIEVED, let's make that clear.
TARGETS OR ENTRY PRICES ARE STRONG SUPPORT AND RESISTANCE LEVELS SO THEY CAN ACT LIKE PIVOT POINTS AND REVERSE THE WAVE (or act like a mirror that can reflects light) BASED ON STRENGTH OF THAT LEVEL.
ENTRY PRICE BLACK COLOR
MOST PROBABLE SCENARIOS TARGETS GREEN COLOR
LEAST PROBABLE SCENARIOS TARGETS RED COLOR
TARGETS ARE NOT EXACT NUMBERS THEY ARE MORE LIKE A ZONE.
DO NOT USE THIS STROTEGY FOR LEVERAGED TRADING.
It will not give you the whole wave like any other strategy out there but it will give you a huge part of the wave.
The BEST TIMEFRAMES for this strategy are Daily, Weekly and Monthly however it can work on any timeframe.
Consider those points and you will have a huge advantage in the market.
There is a lot more about this strategy.
It can predict possible target and also give you almost exact buy or sell time on the spot.
I am developing it even more so stay tuned and start to follow me for more signals and forecasts.
START BELIEVING AND GOOD LUCK
HADIMOZAYAN

NexoHi All,
I hold NEXO tokens as loyalty tokens.
NEXO is a "borrow against your Crypto assets" platform.
I think it got an edge over "CELSIUS"
Watching for a breakout :)
Thnx
Jad

NEXO waiting to break out#NEXOUSDT
NEXO is an ERC-20 token that’s traded as a “restricted security” per the SEC registration exemption filed by Nexo.
Nexo repayments can be made in fiat or crypto currencies. If NEXO is used to repay the loan, a 50 percent interest rate discount is gained.
Holding NEXO entitles you to higher loan limits and a 30-percent Nexo profit-share payment.
$NEXO broke out from long term descending resistance, and now is struggling to break another resistance zone, this break can increase the price to #3.2 and even $4 (80% -150%)

NexoUsdt long If bitcoin remains sideways, I expect a bullish wave on nexo with the first target shown on the chart.
To go further, we need the market to be in good mood; it might be the case if the bold trendline breaks as well.
Good luck.

NEXO Primed to explodeHere are the next few targets for $NEXO.
This is not only based on technicals but this is the governance token for a VERY solid defi platform with great interest rates, no staking required.
Technically you can't beat it, right at the edge of the channel, just recovered from a double bottom and forming a sym tri consolidation. This looks prime to explode to the channel midline, although the prior high may provide some resistance.
This is invalidated if we leave the channel.

Trading ALERT $NEXO Buy!On the 2nd of September @ 0:00UTC $NEXO passes the 2day system buy Rules which you can find on my twitter Pinned Post

NEXOUsdt good position for move upNexo is good position for pump with others not move up and have chanse for moving little late but is good u can got profit others coin adn come after that buy this for late move got profit
GL :)
Supports:
1.7945 >> Entry Point
1.7003 >>Entry Point
1.7003
1.6056
Resistance:
1.9266
2.1500
Targets :
2.3030
2.8899
3.8577
4.4850
5.5678
Targets For HODL:
8.3525
11.1460
12.9629
GOAL :
16.0953
GL Guys

NEXO - potential reversal, back to bullish price actions?Dear Nexonians
After i watched the NEXO Chart for a while now i wanted to share my thoughts with you, because there are multiple signs of a HUGE reversal coming in the near future, if that happens i dont want you to miss that.
First of all we have to consider that BTC will lead most of the movements in the market right now, so BTC also needs a bullish continuation for NEXO to play out like that. We also have to consider that NEXO's perfomance itself just like announcments, FUD or technical problems could have a bullish as well as bearish impact on the chart. Now that we all consider these things i want to start with the explanation of my TA.
At the moment there are multiple bullish signs that speaks for a BIG reversal. The first thing i want to mention is the tripple bottom (red curves), as you see its similar to the most charts atm, also BTC had a similar triple bottom which already played out, so it looks like that this triple bottom had more weight than we thought and it seems like NEXO is lagging behind so i think this could be a important factor for the potential reversal.
The second important factor of this potential reversal would be the clear "W" pattern also known as "cameltoe" which is forming right now, if we break out of this pattern it could lead us to a even faster rise with big momentum, so the breakout would mean even more fuel for the way up. If that pattern doesn't play out like that, it wouldn't be a bearish sign it could just mean that we are seeing more sideways action in this channel before breaking out somehow.
In addition to these two factors, there is a bullish divergence which is also a strong bullish sign and with the other two factors it could lead us through this breakout because the resistance(C), where we at right now, seems kinda strong. So we need the momentum from the "W" pattern and/or triple bottom in addition with the potential upside correction from the bullish divergence to breakout and going to higher price levels or even to a new ATH.
If we breakout of this resistance C, i think the next battle would be between the D1 and D2 resistance because there is a strong demand and supply zone, so we will either going sideways between them or we going back to the resistance C to retest the breakout or to hold the line.
In my opinion we will only drop more if BTC does hard, in that case i think we will not drop more than the support A, anyways as long as BTC will move sideways or up i think we are in a very good position to get this BIG reversal. We also have to keep watching what NEXO itself does because a lot of the BIG movements in the past were around an announcement or a new feature.
STAY TUNED AND BE CAREFULL!
I would love to hear your opinion on all this in the comments. See you there ;)

NEXO ana;uzeAs you can see, according to the chart above, this digital currency has been able to successfully cross its 40-day uptrend channel and is currently stabilizing above 1.45 cents.
Therefore, we expect that due to the positive fundamental and growth (70%), this currency has experienced short-term goals up to the targets shown in the image, if you intend to enter, it is recommended that you enter above the range of 1.50.

NEXO - REVERSALIt’s my first IDEA on trading view, would like to know what the community thinks, comments are welcome.
I hold some NEXO tokens as its the interest I earn on some crypto I hold for the long term.
I plan to sell this NEXO token for USD when it hits the longer timeframe reversal, I don't have much experience in crypto but let’s assume it’s subject to supply & demand, I’ve seen it somewhat respects EMAs and RSI on my research and that crypto may create bubbles and are volatile.
I normally don't trade crypto as it doesn’t have much fundamentals or levels that serve as support and resistance for me but looking to do in the future. (As always risking what i can afford to loose).
Let me know what you think and if technical analysis is good for crypto?
ABOUT ME & MY TRADING STRATEGY:
I normally only trade forex and sometimes stocks.
I do not use stop loss, I manually close trades due to the reversals, I operate multiple small lots that will last a few hours, or few days. (RISK MANAGEMENT).
I sometimes scalp or intraday on EMA 10 on 1H OR 4H timeframe.
When going short a higher lot, when going long a smaller lot - every lot operated is examined that wont exceed risking my account, i don't exceed or use much leverage.
I only enter a trade when RSI is low or high depending on the timeframe I will operate, examining other timeframes - LOW RSI: BUY - HIGH RSI: SELL, always on top of the EMAs never in the middle for 1H 4H 1D or 1W, I may examinate all timeframe before entering and may check correlation or fundamentals.
I have listed all major, minor and emergent forex and choose to operate whichever offers me the best option.
I check the economic calendar for unexpected news.
I TP on EMAs or levels.
RISK MANAGEMENT & PSYCHOLOGY is very important for me, i do not risk want i cant afford to loose.

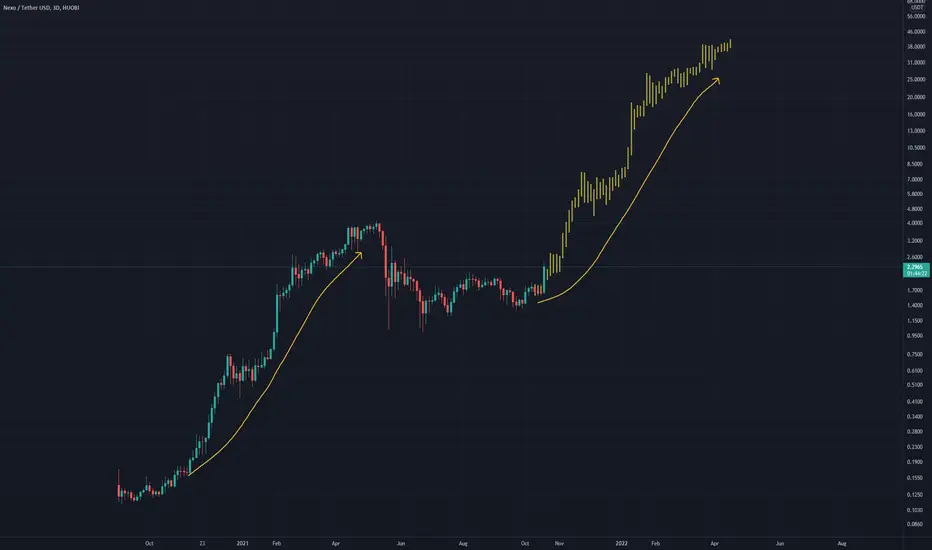
nexo token in clear uptrend?As we can see the nexo token is in a continued uptrend. I've drawn some sine waves that are meant to display the possible trading range if nexo continues it's trend upwards. The blue line represents a price target of $5 for the nexo token by Xmas 2021

NEXO - Whats possible in may?Hey fellow Nexonians
I`m back with another Nexo markup after the last one played out great so far! Its really nice to see how Nexo succeed the last few weeks, i`m really happy that we managed to break the last big resistance without any big announcements and we also managed to surive the big BTC dip better than mpost of the ALTs, thats a great sign for Nexos future and it really shows the strength of the project.
The next bigger resistance is around 3.80$. We also had a double top there and went down to the support at 2.80$ but recovered pretty fast, which also is a very strong sign. The announcements in the next weeks will lead the price of Nexo because of that its really hard to say where and when we will go at diffrent price levels.
So for that i made 3 possibilities:
Bullish scenario 1 (green path line):
We will break the resistance (blue line) at the first attempt and going directly to the upper trend line (white), after that we might see a retest to our last support (resistance before) at around 3.80$. If that holds we could break the upper trendline, retest it and going to 5$ or more.
Bullish scenario 2:
We will not break the resistance at the first attempt and going back to the bottom trend line (white), if that hold we trying the next move to break the resistance and when we broke it we will adjust to the green line like in bullish scenario 1.
Bearish scenario:
I don`t like it either but we have to consider this scenario. Besides the double top which is bearish we also have a bearish divergence which is not good, maybe we can ignore it because we have a really big bullish attitude but if the case will be a bearish movement i think we could break the bottom trend line going back to the support at around 2.80$, retest the bottom trendline and if we dont break that again i think we go down to the resistance at around 1.80$.
Like i said the next announcemts will have a big impact on the chart and could lead to a parabolic breakout so maybe none of this scenarios will happen and we just go up or down, which is very unlikely IMO. Also the bearish scenario is unlikely becsause of the movements we had before on this way up and IMO we are still in a bulltrend so i don`t think that will really happen, but we still have to consider it!
Please tell me your scenario of this markup or some other ideas that could happen.
If you have some question just ask and check out my other Nexo markups which one of them is still running.


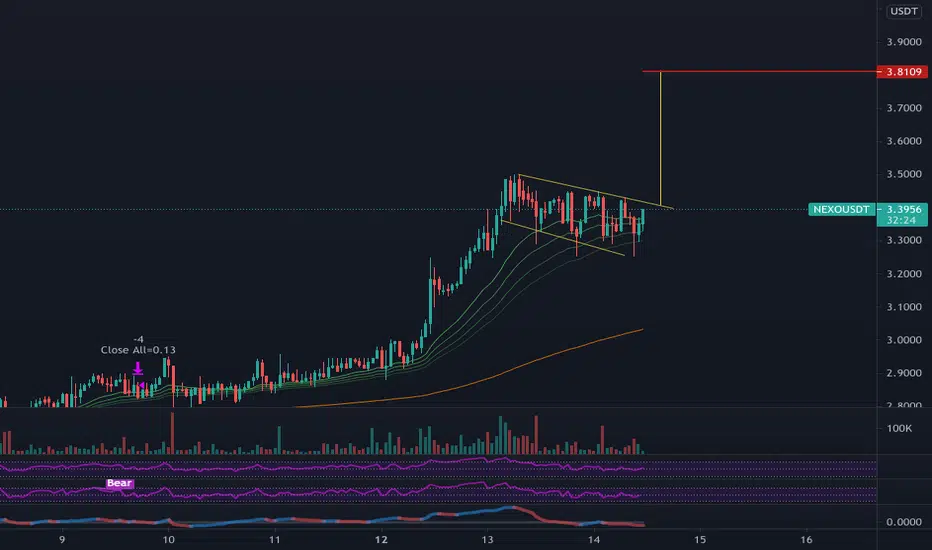
Classic... It's a snake in the GRASS pattern. NEXO:NEX strikes!Lying dormant in wait, She rears her symmetrical triangle head and strikes...... It's the classic snake in the grass pattern.... putting fear in the hearts of the evil short sellers everywhere..... NEX wrecks down your walls and you fall madly in love with her... That is until the next hot Crypto comes along.

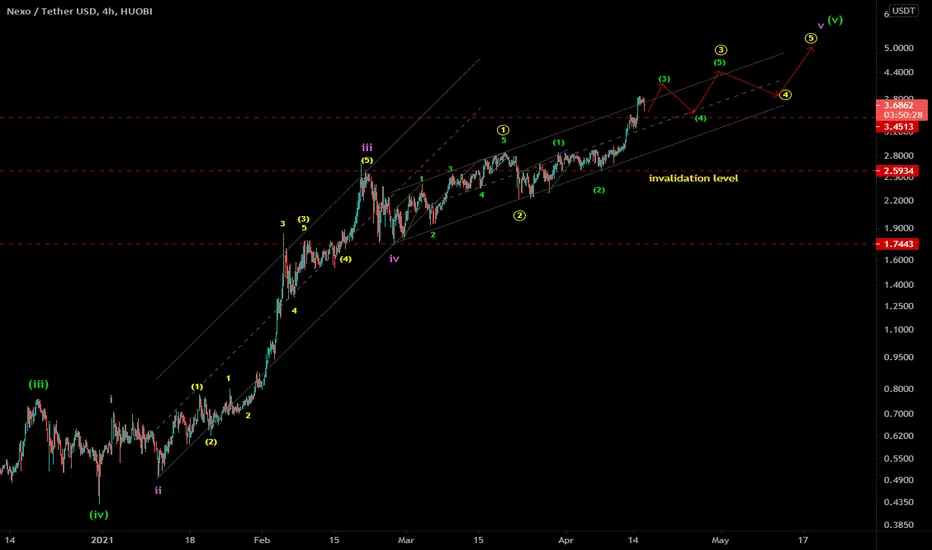
NEXOUSDT - EW analysis - 5th wave NEXOUSDT - It is in 5th wave extension and internal 3rd wave is ON. Sit tight.
Give a thumbs up if you really like the Elliott wave analysis.
NEXO: Strong Breakout Through a Crucial Level ATM at $4 EOMNexo has been on an absolute tear from the Fall of 2020 and the momentum looks to only be picking up. A major breakthrough at the 0.618 Fibonacci level followed by a strong ~20% pump into a new ATH indicates a continuous push well into the 1.618 and 2.618 fib levels. $4 and $5 are major levels to watch out for and keep in mind for possible profit taking opportunities.
