Downtrend Breakout, So Uptrend Confirmation. Long Term AnalysisThis is Long -Term Analysis to understand the "Upcoming" Market Direction. Now Confirmed the Downtrend has Breakout. So market definitely move into Uptrend. It might temporarily move downside as a Retest of the Trendline. Must follow Trend continuation technic.
I marked 0.5 Fibonacci Retracement. It is Next Target for Short Term Traders.
I want to help people Make Profit all over the World throughout my entire life. Additionally, I am eager to Receive Money form Worldwide because of my Potential.
NG trade ideas

Gas TrojanI will be honest with you, I have high hopes that this one could be the project with the biggest success, not necessarily in predicting what the market might do, but how will it act and when and even where. In other words, as usual in most nen projects, most rectangles are simulated projected potential support and resistance zones in their specific time zone, with some exceptions that confirm the rule, or with a caveat. Here is the rundown:
- The biggest of them all lurking above is obvious, if the bulls manage to get the price to that level (most of us doubt it will ever reach that zone in time) they might get scared in that critical juncture of forces that might push it away back into a corner.
- The first one is a potential opportunity if the price reaches it coming from below and with the right candlestick setup it could provide an inflection point for a short. (remember this project takes into account multiple market evolution scenarios, so this doesn't need to happen, it is just a potential)
- The blue and the bigger green rectangles have some exceptions to them as they could act as zones of power influence but also power avoidance, meaning the price can go past their levels from above or from below, as long as the rectangles are not touched or pierced.
- the small rectangle with an icon has no support or resistance in that zone at that price level, this could just act as a milestone or we can use its time stamp to analyze what the market does in that time zone
- The Orange and the Red rectangles are more like stepping stones where corrections might occur from any side/direction where having a lookout for candlestick shadows for potential wave ends should be of greater importance
- speaking of candlestick shadows they should be an overall important class of setups to look out for in the entirety of the project, especially in the longer slim rectangles that are left
- on the bottom right, below the blue curve, I really couldn't come up with any projected simulated potential zones of influence, so I cooked up a grid, chess board style, meaning, we might attempt to figure out where the bishop moves or how the horse goes, if the market actually ends up sliding into that area behind the blue curve.
The project will be considered a success if important, relevant, very obvious, and quite intriguing price action, events, and other coincidences might occur in synchronicity or harmony with the elements in the project. (the more the better, we don't want to be fooled by randomness and the normal distribution of probabilities and potentials into a Picasso drawing). It will be considered a failure if none of the rectangles hold as pivot point zones or inflection areas and the price just keeps breaking them down like they don't even exist or matter, sliding the price into zones that are irrelevant for the project and its elements.
Unfortunately, the nature of the entirety of the project required a wider zoomed out perspective, but I promise I will update comments with specific interesting candlestick setups or patterns that I will consider to be relevant in trying to analyze and maybe anticipate what the market might do, or at least compute a better assessment of the probabilities of the scenarios that could happen and how...
Bon Voyage! This could get very interesting and a really Fun Ride. Also feel free to comment with your own perspective and judgement or bias, regarding what the market might do, especially if we enter into Chess Zone.

NATTY down for a breather NATTY is extremely overextended and finds itself on the 0.5 Fib retracement after accumulating a substantial bearish divergence on the 4hr.
After breaking out of the cup & handle, it has yet retested those areas which it will IMHO.
NATTY often peaks in the middle of May which is often followed my strong consolidation into May, before it really gets going in June/July.


Potential SHARK Harmonic pattern forming on Natural Gas📈 Keep an eye on Natural Gas! 🦈 Potential SHARK Harmonic pattern spotted 📉
This pattern, known for signalling trend reversals 🔄, is gaining attention as it shows distinct Fibonacci ratios and price swings. If confirmed, it could mean significant price movements ahead.
The pattern involves four key points: the initial impulse leg, a corrective retracement, an extension leg, and a final reversal leg. Traders are watching closely as price action approaches the projected reversal point 🎯. Confirmation of the pattern often comes with additional technical indicators aligning with the reversal signal.
In the Natural Gas market, factors like supply and demand dynamics, geopolitical events, and weather patterns play a crucial role. Traders are combining technical analysis with fundamental insights to assess the pattern's validity and potential outcomes 🌍💡.
Stay alert and keep your risk management strategies in check! Whether the pattern leads to a bullish 📈 or bearish 📉 reversal, traders with a keen eye on harmonic patterns and market dynamics will be ready to seize the opportunities 💼💰.

Natural Gas: the monster tradeNAtural gas has broken out of a powerful base.
We have seen some stellar price action over the last couple weeks.
A short squeeze in the making could be brewing.
s we approach some heavy daily and weekly resistance, you may see some profit taking ahead of the next leg up.
The daily 200 MA & weekly 50 MA should be respected until they're broken.

Watch Out for Natural Gas PullbackSince February, the price of natural gas has increased by more than 50%. It seems plausible that this upward trend will not continue at this pace, especially with the warmer season approaching. Seasonally, it's worth noting that natural gas often experiences cyclical highs in the spring, which are rarely sustainable. Based on this premise, supported by technical signals such as a clear bearish divergence in the hourly to four-hour time frames, we are initiating the short trade shown here with an acceptable risk-reward ratio of around 1.5:1.


NATURAL GAS - Important Breakout 🚀
Previously, The Natural Gas Formed a Bullish Falling Wedge Pattern.
On Monday 6 May The Price Broke The Resistance Level (1.973 - 1.893).
Currently, This Key Level is Broken and Becomes a New Support Level !
So, I Expect a Bullish Move 📈
---------------
TARGET: 2.140🎯

25% Bullish Move for NATTY?Natty has reached the lows of Feb - 23 and has retested with some bullish intent.
There's also Bullish Divergence on various timeframes inc. Daily, 4hr, 2hr, 1hr as well as a Monthly on if it holds at these levels for a couple of months, from which we could see a major move up.
Taking the 0.618 fib levels as TP which also retest a previous support level.
Following this bullish move I expect at least a double bottom before going back up again.

Breakout from trendline. Upwards now 👊
Breakout from trendline. Upwards now 👊
We have mapped upside price targets in case the resistance lines are broken. If price gets rejected at the resistance line then price is expected to retrace back to the breakout point and then bounce back up
If it holds we have expect price to bounce towards upper resistance lines and ascending Fib price targets.
Are you buying?

NATYY Bullish H&S StructureQuite clear H&S shoulder pattern has developed on NATTY which began accumulating at the beginning of March of this year.
The green rectangle is the base of the massive accumulation zone which has acted as support previously, now turned resistance.
There's been 2 prior attempts at breaking through, on the third, it broke but wasn't able to hold.
The target is c15% increase in price and also takes us to the gap on 22nd Jan - this was calculated using the distance between the top and bottom of the cup.
GOOD LUCK!


NATURALGAS - Blow Off PhaseNATURALGAS
Pumping today but its coming out of a long ascending channel.
So this is wild and dangerous.
It has again pushed through resistance into the higher liquidity area.
At some point it will likely collapse either to a Golden Window retracement or lower low 👍.
Not shorting.
Not advice


Natural Gas April 22, 2024: Waiting to Break Above the ResistancOn April 22, 2024, CAPITALCOM:NATURALGAS is trading below the resistance of 2.04 - 2.05 (yellow line) from Feb 6, 2024, with 3 bottoms forming as shown on the chart.
A break above this resistance would trigger a buy signal with the target around 2.45 as shown on the chart, the same distance to the resistance as the from first bottom.

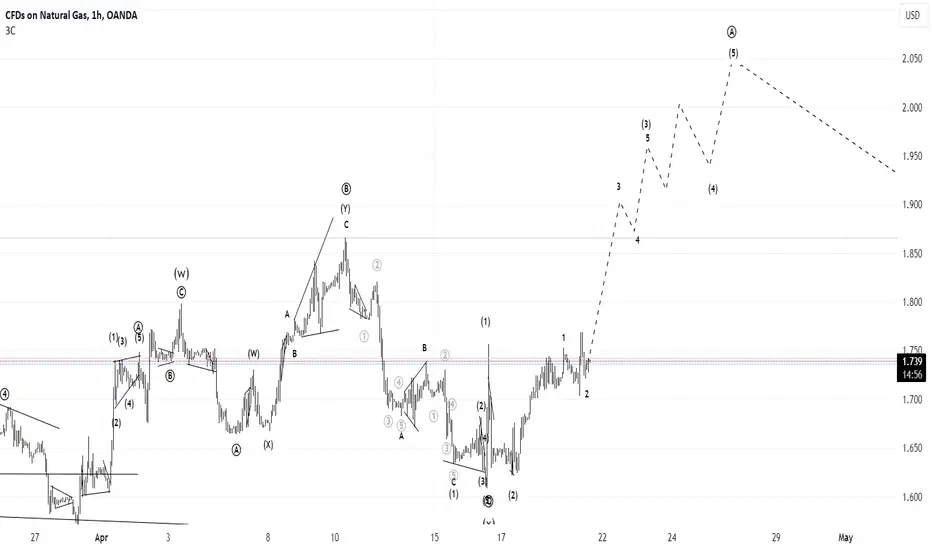
Maturity of the bullish market, any correction pattern extends tEsteemed analysts and traders,
I hope this correspondence finds you in good health and high spirits, prepared to tackle the upcoming week with renewed energy. I extend my best wishes for your continued success in all your business endeavors. It is worth noting that success in trading is largely dependent on the consistent definition and adherence to one's own rules.
As a supporter of the Elliott Wave Principle, I consider this methodology an invaluable tool for market analysis. After three years of personal experience, I have developed my approach by combining this principle with meticulous consideration of different market scenarios. I strive to avoid market surprises by maintaining a range of market prospects, which enables me to recognize the market structure forming with 100% accuracy.
I am pleased to share my analysis with you, with the caveat that I do not provide buy or sell signals. My perspective on idea analysis is entirely impartial, and if my analysis meets your standards, it may serve as a guide to making an informed decision.
For your reference and comparison, I have attached my previous analysis of the same market. All the details of my analysis are clearly labeled for ease of comprehension. Nonetheless, familiarity with the Elliott Wave Principle theory would facilitate an understanding of the analytical idea.
My study of the Elliott Wave Principle took nearly three years, during which my understanding and experience with this invaluable tool have grown. My progress thus far is a testament to the legacy of Ralph Nelson Eliot, whose genius has provided the foundation for my achievements. May he rest in peace.
I express my gratitude for your continued support and kindness, and welcome your comments and critiques.
May my analysis be a valuable asset to your business journey, and I remain sincerely yours,
Mr. Nobody

Natural gas long viewThe price of gas is moving away from the previous bearish trend. January and February were extremely bearish. March was a month of consolidation, and April initiated a bullish consolidation supported by EMA20 and EMA50 daily. The price is currently at the $2.05 level, and before the next bullish run, a pullback to the $1.95 support zone is possible.

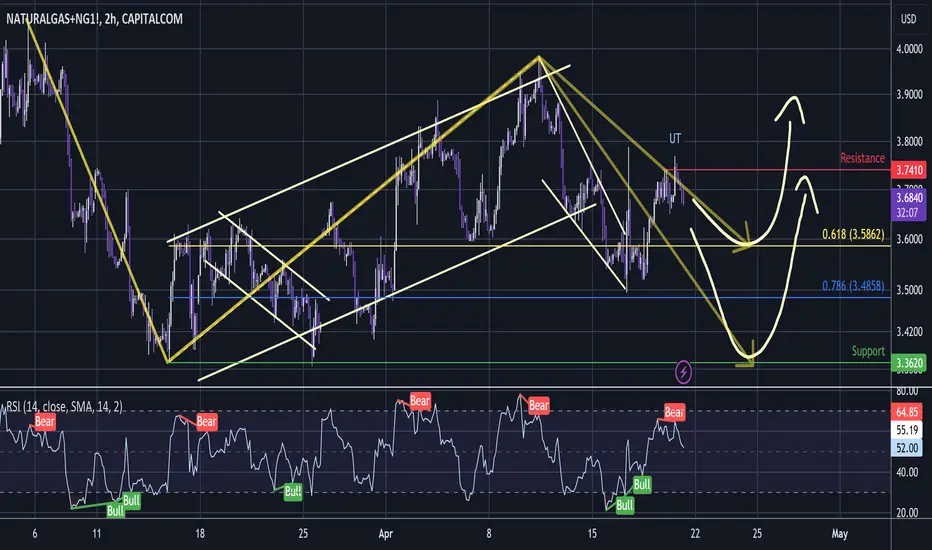
Natural Gas - Lower Time Frame UTNatural Gas
Now showing bearish divergence on the 3 hour chart after a higher high shakeout.
That is very likely to be a Wyckoff UT UpThrust.
This signals that the current wave up is now more likely to be a connective wave and there will be another bearish wave to follow.
Perhaps it gets back to somewhere around the 0.618 are perhaps it will get all the way back to the previous support low @$3.362 and that would complete a flat pattern.
Both are probably about equal odds and we'll need to see more.
I have taken some profit in this area but will hold a small amount through the area for long term👍.
Not advice