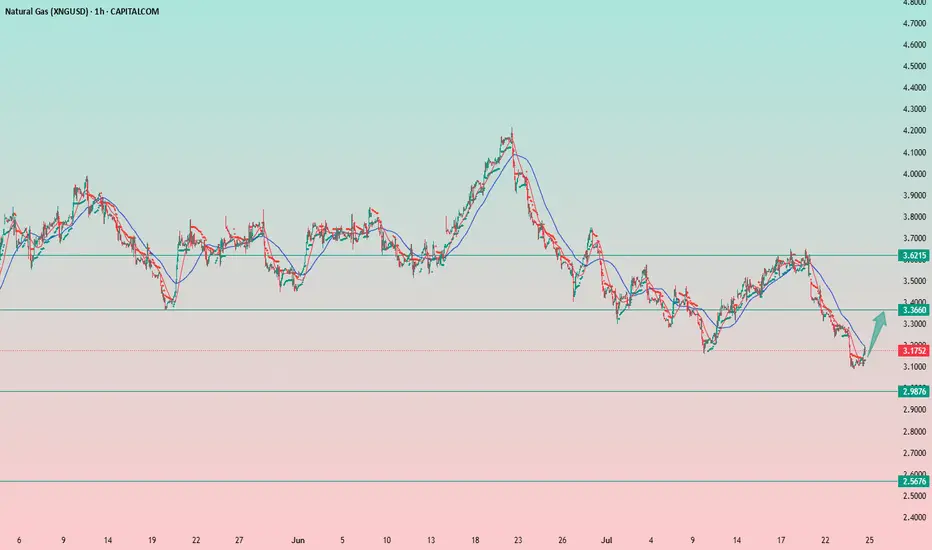
XNGUSD CONTINUES ITS DOWNWARD TREND. FOR HOW LONG?XNGUSD CONTINUES ITS DOWNWARD TREND. FOR HOW LONG?
Recent bearish impulse started at the beginning of this week may come to an end soon. Yesterday the U.S. Natural Gas Storage report came out. Numbers appeared to be lower than expected and lower than previous. (23b vs 28b vs 46b). This is bullish signal for the market participants. Minutes after the report came out, market reacted bullish, however, soon price went sideways.
Right now gas prices continue to decline. Still, the opportunity for short-sellers here is quite limited. Not so far below there is a level of 3.0000, form where I expect the price to rebound, supposedly to a 3.3000.
NGAS trade ideas
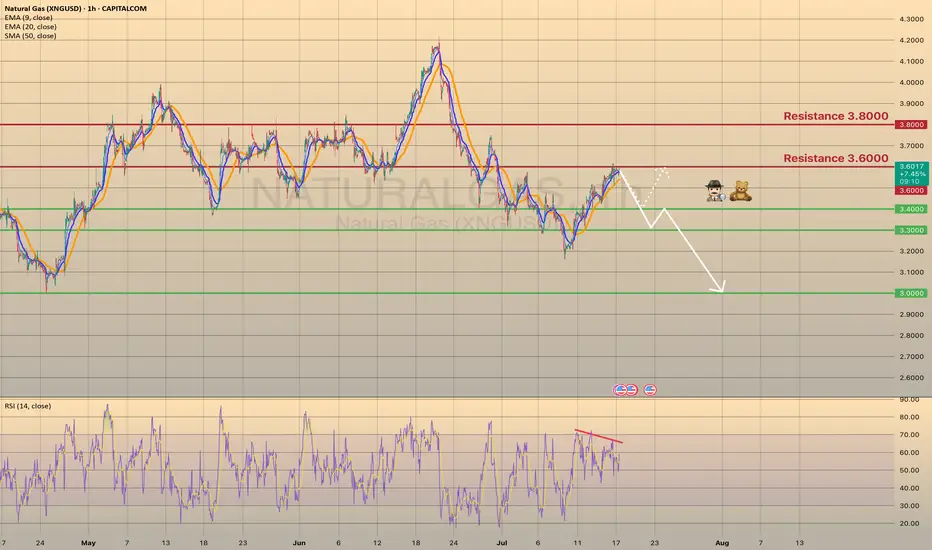
Natural Gas is in the Buying DirectionHello Traders
In This Chart NATGAS HOURLY Forex Forecast By FOREX PLANET
today NATGAS analysis 👆
🟢This Chart includes_ (NATGAS market update)
🟢What is The Next Opportunity on NATGAS Market
🟢how to Enter to the Valid Entry With Assurance Profit
This CHART is For Trader's that Want to Improve Their Technical Analysis Skills and Their Trading By Understanding How To Analyze The Market Using Multiple Timeframes and Understanding The Bigger Picture on the Charts
Natural Gas Price Drops by 7%Natural Gas Price Drops by 7%
As the XNG/USD chart shows today, natural gas is trading around $3.333/MMBtu, although yesterday morning the price was approximately 7% higher.
According to Reuters, the decline in gas prices is driven by:
→ Record-high production levels. LSEG reported that average gas output in the Lower 48 rose to 107.2 billion cubic feet per day so far in July, surpassing the previous monthly record of 106.4 billion cubic feet per day set in June.
→ Favourable weather forecasts. Although the peak of summer heat is still anticipated, forecasts indicate that temperatures over the next two weeks may be lower than previously expected.
As a result, today’s XNG/USD chart appears bearish.
Technical Analysis of the XNG/USD Chart
The chart indicates that since mid-May, natural gas prices have been fluctuating within a descending channel (marked in red), with July’s peak (E) highlighting the upper boundary of the pattern.
A key resistance area is now represented by a bearish gap, formed between:
→ the former support level at $3.525;
→ the $3.470 level – which, as the arrow suggests, is already showing signs of acting as resistance.
Under these conditions, it is reasonable to assume that the price may continue forming a downward market structure A-B-C-D-E, consisting of lower highs and lows, potentially moving towards the channel’s median – which approximately corresponds to July’s low (around the $3.200 level).
This article represents the opinion of the Companies operating under the FXOpen brand only. It is not to be construed as an offer, solicitation, or recommendation with respect to products and services provided by the Companies operating under the FXOpen brand, nor is it to be considered financial advice.

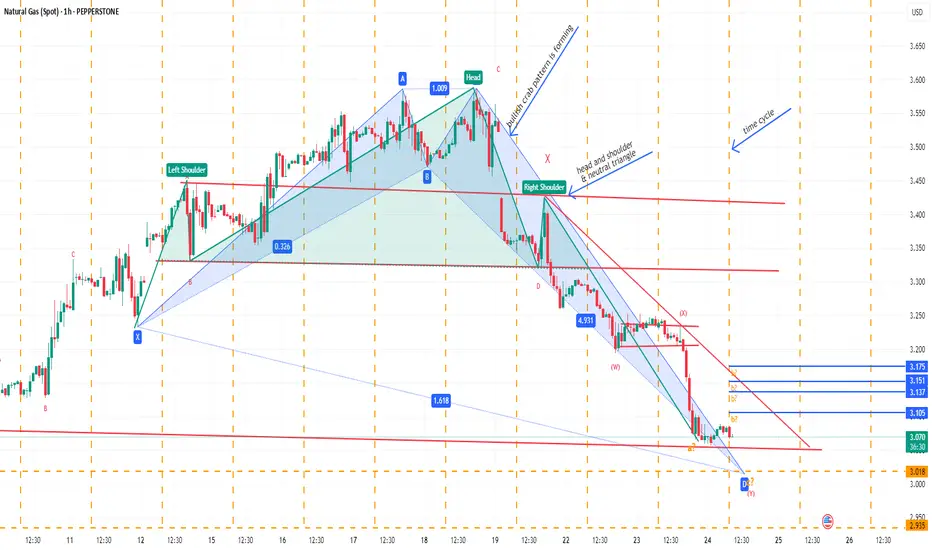
Natural gas spotHead and shoulder pattern observed and neo wave wise also appear either neutral triangle , if break neck line good fall and then near another bigger head and shoulder neckline. Let see

XNGUSD Technical Update – What the Chart Is Telling Us NowIn this video, I break down the current XNGUSD (Natural Gas) chart using pure price action analysis on the daily timeframe.
This update builds on my previous post, where I shared a comprehensive outlook supported by fundamentals, including supply/demand imbalances, geopolitical risks, and long-term LNG export growth.
In this video, I focus purely on the technical picture—highlighting key levels, market structure, recent consolidation, and where I see potential opportunities unfolding next.
📈 If you're trading or investing in Natural Gas, this is a must-watch update to stay in tune with the current market dynamics.
Remember: This is not financial advice. Always do your own research and manage risk appropriately.


NATGAS Long Setup – Accumulation + Breakout OpportunityInstrument: US Natural Gas (Spot)
Timeframe: 1D
Published: July 24, 2025
By: @Rendon
📈 Idea Summary:
Natural gas is showing signs of accumulation after a corrective downtrend. Price recently tested key horizontal support around $2.96–$2.85 and is now attempting a recovery. Two potential bullish scenarios are outlined:
🧠 Bullish Scenarios:
🔵 Scenario A (blue path): Clean breakout above $3.32 with strong volume could lead to a continued push toward $3.56 → $3.79 → $4.05.
🔴 Scenario B (red path): Price may first retest the $2.96–$2.85 demand zone again before bouncing and gradually rallying toward $4.05.
🔍 Key Levels:
Support: 2.961 / 2.957 / 2.854
Resistance: 3.323 → 3.568 → 3.792 → 4.046
🛑 Invalidation:
A decisive close below $2.84 would invalidate the bullish thesis and suggest further downside risk.
📊 Volume Insight:
Volume has been drying up, which may indicate a potential spring or absorption before a breakout.
✅ Trade Plan (example):
Entry: On retest of $2.95 or break of $3.32
Stop Loss: Below $2.84
Target: First TP at $3.56, then trail toward $4.05
💬 Let me know in the comments how you see NATGAS developing and which path you’re betting on!

NATURAL GAS SPOTBullish crab pattern may form, if another harmonic pattern may develop later.
Neo wave wise may be in wave Z need confirmation.
Time cycle high low break may be trend continue in break out/down direction.
Not sebi research analyst.
Triple Bottom @ Natural GasNaturalgas is near triple bottom
Best level for accumulation
Pure price action 💯

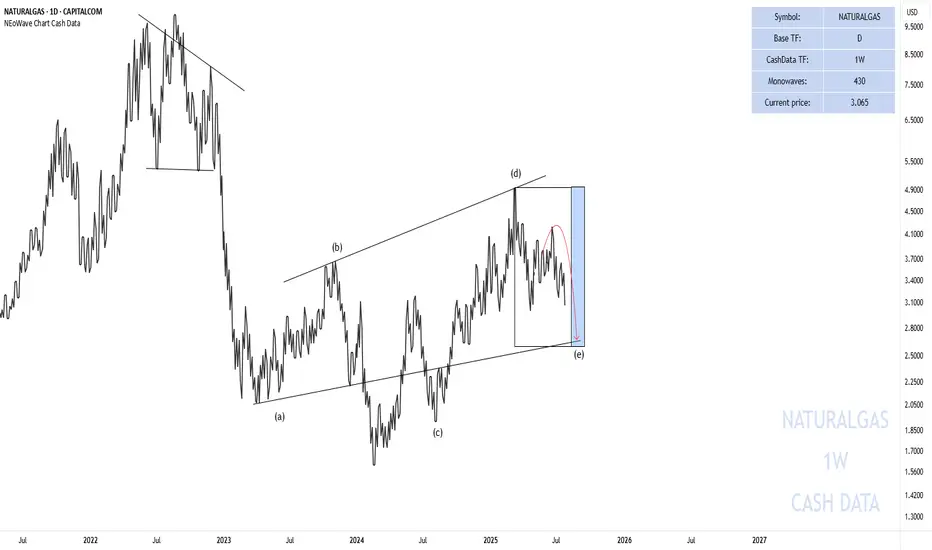
End of the Wave-(e) Natural Gas
In the previous analysis I said that:
Currently, wave-(e) is forming and I do not expect a strong upward movement until August 12-September 12 and this wave can take time until the time range I specified for it.
In the picture you can see that the price has started to decline again exactly from where we specified and has fallen by 27% so far. The price is not necessarily going to fall to 2.66 but time must pass and the price must enter the specified time range.
Good luck
NEoWave Chart
Natural Gas is in the Buying DirectionHello Traders
In This Chart NATGAS HOURLY Forex Forecast By FOREX PLANET
today NATGAS analysis 👆
🟢This Chart includes_ (NATGAS market update)
🟢What is The Next Opportunity on NATGAS Market
🟢how to Enter to the Valid Entry With Assurance Profit
This CHART is For Trader's that Want to Improve Their Technical Analysis Skills and Their Trading By Understanding How To Analyze The Market Using Multiple Timeframes and Understanding The Bigger Picture on the Charts

U.S. NATURAL GAS - BEARISH WEDGE WORKED OUT. WHAT'S NEXT?U.S. NATURAL GAS - BEARISH WEDGE WORKED OUT. WHAT'S NEXT?
Today, the market opened 2.66% below its closing price on Friday. The current price has already fallen on 4.8% since the closing on Friday, and it is now above the 3.400 support level. I expect further decline, however, with a possible rebound from the current level and pullback towards the SMA50, with a final target of 3.000.

Sell NATGAS into OCT/NOVNatalie has fromed a H&S and has broke through all of the supporting EMAs leading to most of the indicators turning bearish.
My approach for the forseeable is seeling bounces until the winter season approaches.
Of course Natalie is extremely susceptible to trend changes due to economical data and has to be monitored closely. Currenlty I'm a bear.
Only selling once it breaks and retests, where I will once again reasses based on economics such as storage, production, imports and demand.
Target around $2.5 where interestingly a gap (red rectangle) sits from Nov - 24.
Elliot Wave (although not a great fan) kind of aligns as well as the 0.786 fib level which began forming at the beginning of 2024.
Storage | Volatility | Price Outlook
U.S. natural gas markets are stabilizing as volatility trends back toward seasonal norms.
📉 Volatility has dropped from 81% in Q4 2024 to 69% in mid-2025
🏪 Storage is currently at 3,075 Bcf,
🔻 4.7% lower YoY
🔺 5.9% higher than the 5-year average
🚢 LNG exports remain strong—up 22% YoY and 74% above the 5-year average
🔌 Domestic demand is seasonally weaker but steady
➡️ Despite being below last year’s levels, storage surplus vs. the 5-year average acts as a soft ceiling on price.
➡️ Historical analogs suggest a fair value range between $2.50–$3.20/MMBtu in the short term.
📊 Current price action around $3.00–$3.40 looks slightly overheated unless a fresh catalyst emerges (heatwave, export spike, etc.).
🧭 Watching for:
Injection trends over the next few weeks
Cooling demand in power sector
Resistance around $3.40
Support near $2.80
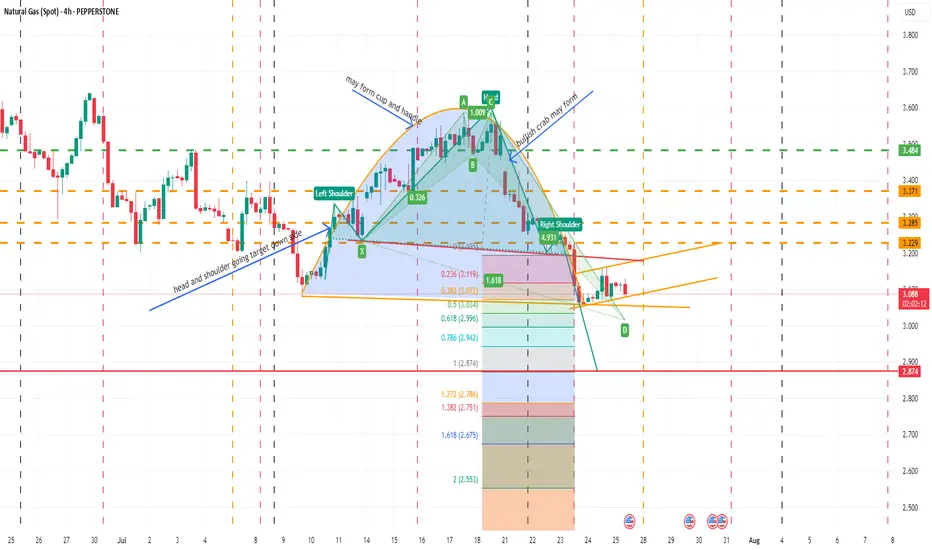
NATURAL GAS SPOTMay form inverse cup and handle, bullish crab also about to form , after completing one head and shoulder pattern already posted earlier new head and shoulder going on. In daily and 4 hr chart below ichimoku cloud. In weekly within cloud. Moving averages showing weakness in daily and weekly, monthly candle also no bearish. May be in such scenario bullish crab pattern may fail but need to be careful as over sold territory. Let see how all works in future though so far all as per analysis. I am not SEBI registered analyst.
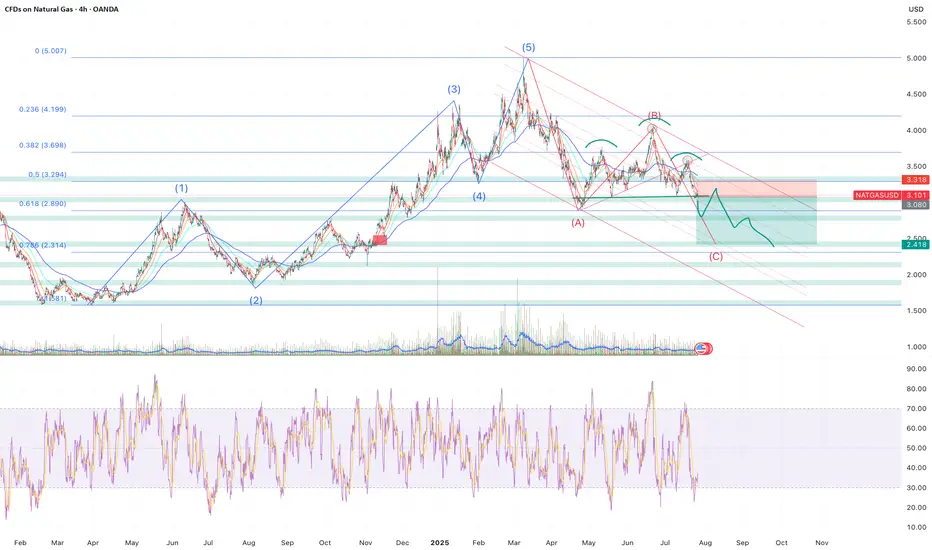
The technical analysis for Natural Gas (NG) 📉 Current Market Structure & Interpretation
🟢 Elliott Wave Count (Bearish Impulse in Progress)
The chart suggests a 1-2-3-4-5 impulsive wave is unfolding on the downside.
Currently, NG appears to have completed Wave 2 (retracement) and Wave 3 is in progress, heading toward a major breakdown.
The structure projects Wave 3 → Wave 4 pullback → Wave 5 final leg.
🔍 Fibonacci & Key Levels (Bearish Projections)
Wave 3 Target Zone:
-1.0 Fib Extension (~3.00) marked as "double"
Strong support break zone; high probability breakdown confirmation
Wave 5 Completion Target:
-2.0 Fib Extension (~2.807) highlighted as major support
Also aligns with a long-term base/accumulation zone
Extreme Bearish Target:
-4.23 Fib (~2.687) – only in case of panic sell-off (marked “Quintuple”)
📊 Volume & MACD Histogram (Lower Panel)
Strong bearish momentum in MACD histogram: red bars extending and deepening.
Bearish volume expansion visible during Wave 1 and Wave 3 fall, validating impulsive nature.
No sign of volume divergence yet – supports continuation.
🔄 Retracement & Pullback Zones
Wave 4 likely to pull back between:
0.25–0.382 retracement of Wave 3
Could test the area around 3.04–3.08, before turning back down
⚠️ Invalidation & Risk Level
If price breaks above 3.13–3.16 (0.618 level of the total fall), wave count may get invalidated.
Otherwise, structure remains bearish.
🎯 Short-Term Trade Plan (Bias: Bearish)
Aspect Details
Entry Zone Any pullback near 3.04–3.08 (Wave 4 zone)
Target 1 3.00 (Wave 3 completion)
Target 2 2.807 (Wave 5 final target)
SL/Invalidation Above 3.13–3.16
Trade Type Short / Put Option / Futures Sell
Bias Intraday to Short-Term Positional
✅ Conclusion
The chart shows a well-structured Elliott bearish impulse, currently in progress with strong downside momentum. Expect further continuation toward 2.80 zone, barring any invalidation above 3.13. The Fibonacci confluence and momentum support this outlook.
Disclaimer:
This analysis is for educational and informational purposes only and should not be considered as financial or investment advice. Trading in commodities, options, and futures involves substantial risk and may not be suitable for all investors. Always conduct your own research and consult with a qualified financial advisor before making any trading decisions. The author or publisher is not responsible for any losses incurred from trading decisions based on this analysis.
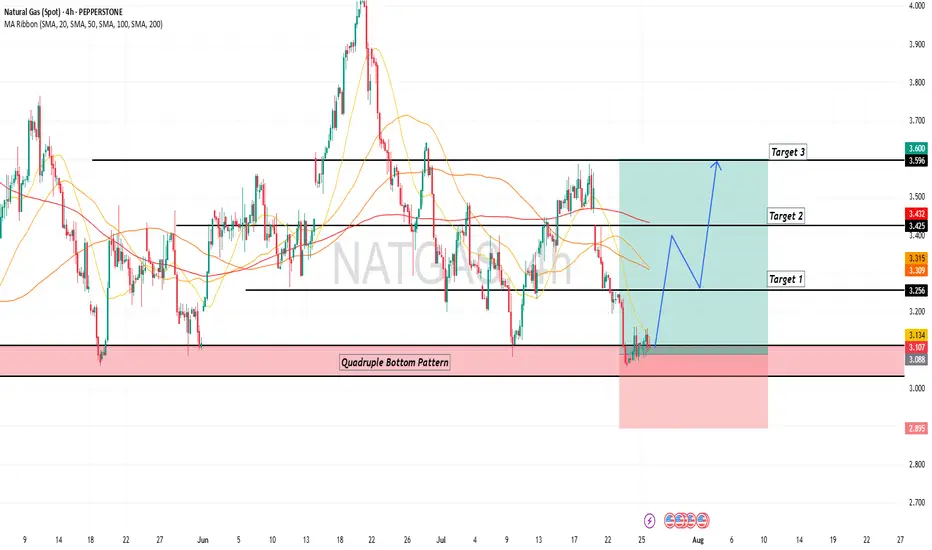
Natural Gas: Long Setup After Healthy PullbackNatural gas has made a decent pullback, and a solid long setup is forming here with a relatively tight stop-loss for gas.
If the stop gets hit, the second entry will be from the $3.00 level.
Entry is from current levels.
📝Trading Plan
Entry: Entry is from current levels.
Stop Loss: 3.0855
Target: 3.36
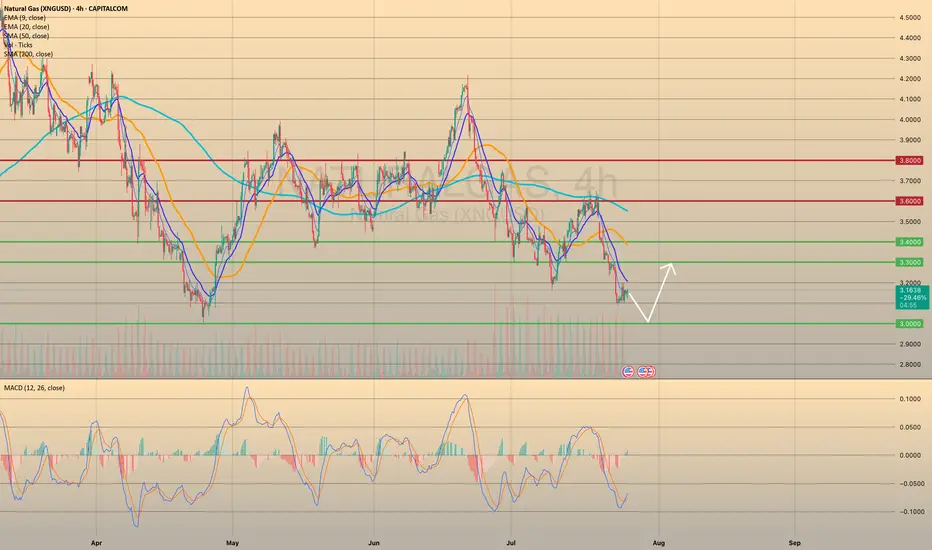
U.S. NATURAL GAS - BEARISH DIVERGENCE DETECTED
U.S. NATURAL GAS - BEARISH DIVERGENCE DETECTED🕵🏻♂️
The Natural gas has been trading bullish for 7 days in a row since last Wednesday, reaching the 3.6000 resistance level. Primarily this happened due to a warm weather in the U.S. states, that supports the demand on gas. Despite warmer-than-normal summer weather, analysts expect energy firms to inject more gas into storage than usual in coming weeks. Record-high output in June, likely to be surpassed in July, and reduced gas flows to LNG export plants since April's peak, support this trend.
Technically chart shows us a bearish divergence on 1-h timeframe. I suppose the price to slowly decline towards major support level of 3.0000 with minor rebounds. The 2nd option is the rebound from 3.4000 support level with a first target of 3.6000.
Natural Gas is in the Buying DirectionHello Traders
In This Chart NATGAS HOURLY Forex Forecast By FOREX PLANET
today NATGAS analysis 👆
🟢This Chart includes_ (NATGAS market update)
🟢What is The Next Opportunity on NATGAS Market
🟢how to Enter to the Valid Entry With Assurance Profit
This CHART is For Trader's that Want to Improve Their Technical Analysis Skills and Their Trading By Understanding How To Analyze The Market Using Multiple Timeframes and Understanding The Bigger Picture on the Charts

Natural Gas two possible scenarioNatural Gas is testing major structure level. I provided two possible scenarios with low risk and good win ratio.

Nat Gas spotMade Bearish butterfly and Bearish dragon too but only presenting butterfly and also appear end of wave X as 81% retracement form one previous top also completed. let see

Natgas long term target 4Natural Gas (NATGAS) | 4H Chart Analysis
We are seeing a strong technical setup developing on Natural Gas. Price has recently bounced off a key ascending trendline support around the 3.00–3.10 area, with clear higher timeframe structure still intact.
Trade Plan:
Entry: Around 3.10, after confirming support at the rising trendline.
Stop Loss: Below 2.94 support (invalidates the bullish setup).
Targets:
TP1: 3.32 (first resistance, previous highs)
TP2: 3.57
TP3: 3.79
Final TP: 4.04
Trade Rationale:
Strong trendline support and recent bullish reaction.
Clear stepwise resistance levels to take profit along the way.
Risk well-defined below previous swing lows and support.
Things to Watch:
A daily close below 2.94 would invalidate this long setup.
Monitor for bullish volume on up-moves and news catalysts (storage data, weather, etc.).
Personal note:
This is not financial advice, just sharing my technical view for educational purposes. Please do your own research and manage your risk!

Heatwave Fuels Breakout as Fundamentals AlignNatural Gas has reclaimed the spotlight with a sharp move above $3.56, breaking through a key resistance level as a heatwave grips large parts of the United States. With above-average temperatures forecast to persist into late July, demand for cooling remains elevated, significantly boosting power consumption across the board.
Supply remains tight despite elevated production levels. Liquefied Natural Gas (LNG) feedgas volumes are rising as export demand holds strong, keeping domestic stockpiles in check. While some temporary relief in demand could arrive next week, the broader outlook remains bullish. Weather models suggest persistent heat, and traders are increasingly positioning for sustained tightness in the balance of supply and demand.
Technical Setup:
• Key level breached: $3.48 (100-day EMA) decisively broken
• Current price zone: Approaching $3.57, the next major pivot
• Momentum: If bulls secure a weekly close above $3.57, the market could enter a longer-term uptrend with $3.65 and $3.80 in sight.
Takeaway: Natural gas traders should monitor weather patterns and storage data closely. Sustained heat could keep the rally intact, but short-term pullbacks may offer entry points for trend-followers.
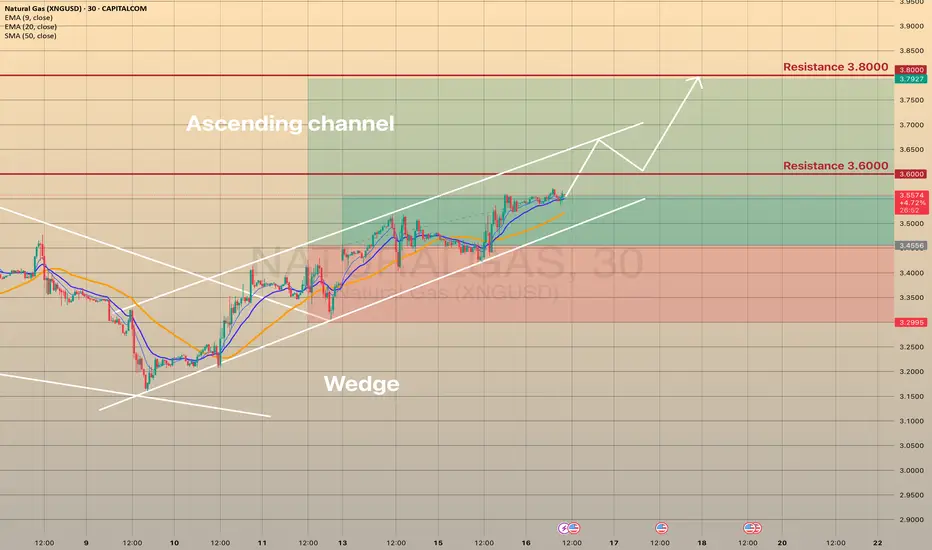
NATURAL GAS - STILL IN THE GAME TRADING IDEA UPDATE -
NATURAL GAS - STILL IN THE GAME🔥
The XNGUSD goes quite well, as predicted. It held the trendline and moving upwards slowly, but surely. Short-term support here is the EMA20 on 4h timeframe. The asset is just below 3.600 resistance level and sma200. Since the July 10, the asset seems to be moving within the ascending channel (pic 2). I expect that the price will break the 3.6000 resistance level, will go towards upper channel border and then, after quick retest, move towards 3.8000. Not a trading advice! Trade cautiously!