Gas xngusd#Gas - H4
📣 Looking at the 4-hour timeframe, if the support level at 3.405 is broken, it may indicate a potential price decline towards the 3.130 range.
⛔ Stop Loss: 3.640
NGAS trade ideas

Natural Gas - Big moves aheadNATGAS has been putting in consecutive higher highs for the better part of a month. This is indicative of a further move up as called over a month ago. Until this trend is broken we remain bullish and are looking to break the first resistance which should then lead us to 3.5$ very quickly.
BULLISH

NatGas Creeping BullisH !Hi friends, Sharing one day chart of Natural gas for my trading idea in it, As we can see that price is consolidated in parallel channel from many weeks and now trying to break channel resistance so if it will break resistance and if close above resistance we can see above marked target can arrive in coming sessions, Price has come here so far by making higher lows and now trading above from last swing high so we can assume it is starting of trend reversal in it One Triangle breakout already occurred inside in channel.
I don't think there is any need to write a long description because charts have their own language, you just have to understand it.
This is not and trade or investment advice. This idea is meant for learning only.
Best Regards happy trading- Amit

Programmed?I think at the very least this is Destined for the 200 EMA on the weekly...
Expecting a bumpy ride to get there (the don't call it "The Widow Maker" for no reason, but tbh looking at these impulsive candles it could blast up there pretty quick 🤔

🖕 NatGas Update The steepness of the rise made me construct another alternative. If the price starts consolidating we are likely to keep going up. Next few hours will show the way.
If the price makes a U turn in the next half an hour I will be tempted to short with a tight SL. Not advice.
Colour coding for reference
🟢 - green represents those in which I am reasonably confident (does not mean bullish).
🟡 - yellow, I can see a possible count, but ready to reconsider at any moment.
🖕 - just f..king around to find out (if Tradingview continues to ban them, I'll show another finger)

Reviews on NATGASJust a review on NATGAS and the direction I would want to see it pull towards.
Disclamer: Poor audio quality.

🟢 NatGas UpdateI believe we are on track with what I posted previously. At his moment I think the odds for near term (next two weeks) bearish case are rising.
I will give this idea a green label based on my growing confidence in the bigger picture which allows me expect only few combinations in the near term
Colour coding for reference
🟢 - green represents those in which I am reasonably confident (does not mean bullish).
🟡 - yellow, I can see a possible count, but ready to reconsider at any moment.
🖕 - just f..king around to find out (if Tradingview continues to ban them, I'll show another finger)

Natural Gas Futures: Too high, too fast?? Natural Gas price flirts with a fresh 2023 high (www.fxstreet.com)
Natural Gas prices jump to $3.42 as tension builds around possible invasion. The US Dollar reclaims its status as King Dollar

XNGUSD, DailyNatural gas had broken the trading range and achieved $3.6 per contract. Given the situation in the commodity markets, natural gas may continue moving higher after testing the $3.2-$3.4 level.

XNGUSD, DailyNatural gas had broken the trading range and achieved $3.6 per contract. Given the situation in the commodity markets, natural gas may continue moving higher after testing the $3.2-$3.4 level.

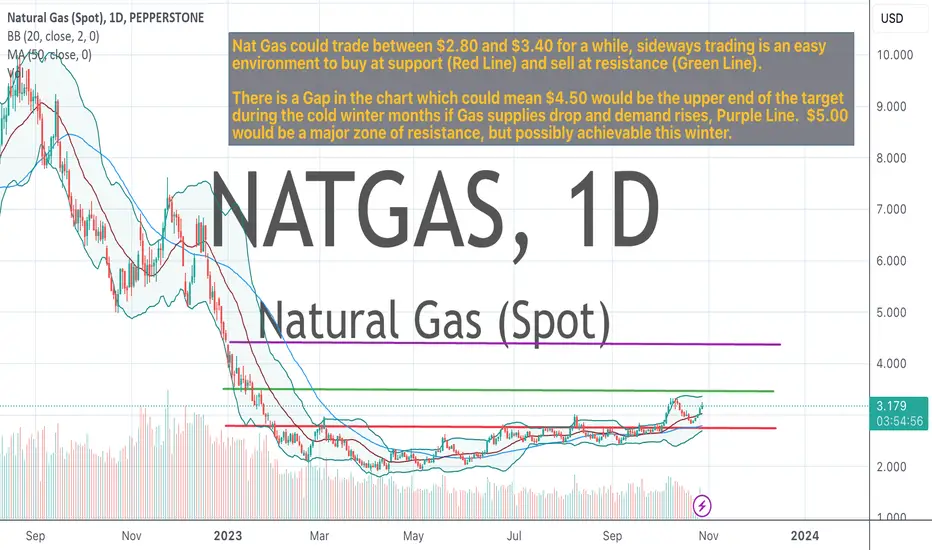
NatGas Trade - Bullish Med TermNat Gas could trade between $2.80 and $3.40 for a while, sideways trading is an easy environment to buy at support (Red Line) and sell at resistance (Green Line).
There is a Gap in the chart which could mean $4.50 would be the upper end of the target during the cold winter months if Gas supplies drop and demand rises, Purple Line. $5.00 would be a major zone of resistance, but possibly achievable this winter.
NatGas UpdateThough I am reaonsably certain in the big picture of the upward trend the near term wave count can unfold in many ways.

NATGAS - BullishThe long idea continues to play out on NATGAS.
We had a recent retest of the upsloping 20ema which has just crossed over the 200dma which has now flattened out.
First target = 4.30
Stoploss = 2.75
Crossing Event: When the 20 EMA crosses above the 200 DMA, it’s often seen as a bullish signal, indicating that short-term momentum is rising faster than the long-term trend. Conversely, when the 20 EMA crosses below the 200 DMA, it’s often seen as a bearish signal, indicating that short-term momentum is falling faster than the long-term trend

$NATGASchecking the widowmaker for old time's sake
bouncing for now with stoch trying to turn up
could be a quickie long but recon we deviate below this range at some point
that would be your entry for a long term ride to double digits with a stop at below ATL or a reclaim of current range low
sometimes 1 trade is all it takes if executed properly, trend is your friend till the end ;)
XNGUSD LONGLONG Pattern trading
Target1= 3.615
Target2= 3.9
In long term it will go LONG positioning.
Happy trading traders.
Hope you liked the idea

NatGas Update A humble attempt to preempt the running flat based on moving averages dynamics (not shown on the chart).


NATURAL GASLook for your tailored entry model at the discounted level of demand and buy it up to the equal highs

reversal can come anytime now 🔥NATGAS bearish downtrend/broke support from 2020/2021 but the selling pressure is really slowing down now
break back above support (2.50) + break of TL resistance = rally back to 3.45-4.73-5.68 🎯
boost and follow if this helped! thanks 😏

Natural Gas - Elliott Wave Count UpdateNatural Gas - Elliott Wave Count
this is an update to the previous view.
Today, the market reached a new low after a few consecutive days of decline. The current reversal appears to be the start of wave C of 4. However, it is best not to rush into buying at this moment. We can anticipate another low after the completion of wave 4, which will be an excellent opportunity to buy for a significant gain.
Please note that this information is solely for educational purposes, and it is essential to exercise caution when trading.
CAPITALCOM:NATURALGAS MCX:NATURALGAS1! FOREXCOM:NATURALGASCFD PEPPERSTONE:NATGAS CITYINDEX:NATURALGASCFD MOEX:NG1! NYMEX:NG1! VANTAGE:NG

Natural gas - UpdateNatural gas - Elliott wave count
Weekly chart seems like bearish which is completely opposite to our view which we posted earlier.. this bearish view also possible so better be careful or atleast wait for some good reversal signal to take buy.
This is an update to the previous view posted.

Natural Gas: It Moved Down More Than ExpectedNatural Gas: It Moved Down More Than Expected
Natural gas has been very volatile recently.
During these daysNG price moved down at a time when OIL and precious metals were growing.
I'm not a big fan of NG as it tends to create a lot of fake patterns.
However, the price is again offering a bullish pattern and it is likely to rise further.
So let's see what happens!
Thanks and good luck!

NATGAS testing $3 After the prolific run last year, Nat Gas has struggled but now it has broken out of $3 barrier and currently testing previous resistance.
Seasonals are good here with up to mid of November, suggesting higher prices.
Any unwelcomed activity in Strait of Hormuz can really send Nat Gas flying.
