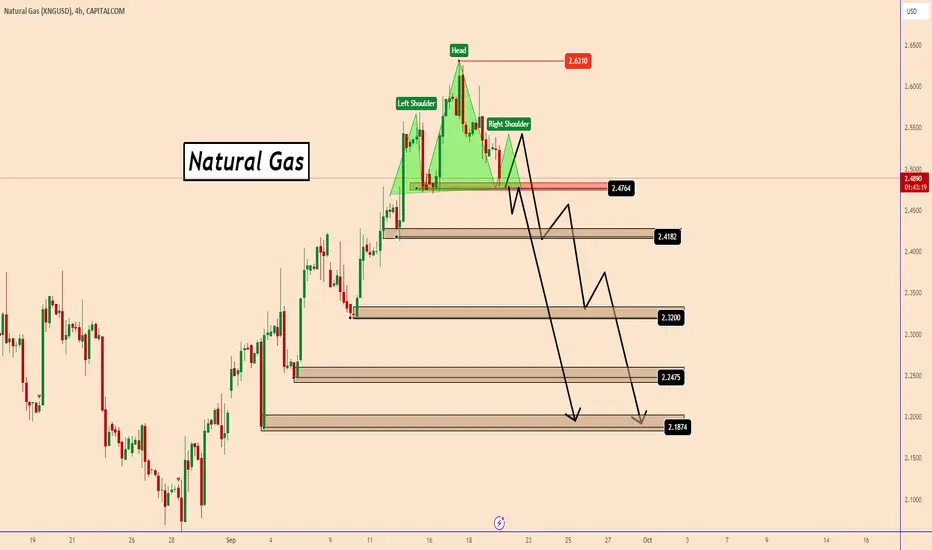
Natural Gas Likely Reached the Peak at 2631Natural Gas Likely Reached the Peak at 2631
Natural Gas is about to form a Head and Shoulders pattern. The price is approaching the neckline zone, and a small correction for the right shoulder of the pattern is expected. If this occurs, the odds are higher that Natural Gas will move down.
If Natural Gas moves below the neckline of the anticipated pattern, it may develop into another bearish pattern.
You can find more details on the chart.
Thank you :)
NGSUSD trade ideas
Long trade
Trade Setup:
Entry Price: 2.232
Profit Level: 2.632 (17.92% gain)
Stop Loss Level: 2.156 (3.47% risk)
Risk-Reward Ratio (RR): 5.26
The setup is supported by fundamental factors like seasonal demand for natural gas, and potential supply constraints. Price level 2.232 represents a support level and the profit target of 2.632 is (17.92% gain) aiming for a key resistance level.

AUD/JPY Short, AUD/NZD Short and NATGAS/USD ShortAUD/JPY Short
Minimum entry requirements:
• Tap into area of value.
• 1H impulse down below area of value.
• If tight 5 min continuation follows, reduced risk entry on the break of it.
• If tight 15 min continuation follows, 5 min risk entry within it, or reduced risk entry on the break of it.
AUD/NZD Short
Minimum entry requirements:
• Break above area of value.
• 1H impulse down below area of interest.
• If tight 5 min continuation follows, reduced risk entry on the break of it.
• If tight 15 min continuation follows, 5 min risk entry within it, or reduced risk entry on the break of it.
NATGAS/USD Short
Minimum entry requirements:
• Tap into area of value.
• 1H impulse down below area of interest.
• If tight 5 min continuation follows, reduced risk entry on the break of it.
• If tight 15 min continuation follows, 5 min risk entry within it, or reduced risk entry on the break of it.

Natural Gas down to 2.3200 before up to 3.1350 IDEASo this is how is see Natural Gas price to react in the upcoming days and weeks.
The price is moving according to 12345 Elliott Impulse Wave, so it will now go down to touch the 4th impulse at around 2.3200 support area. It will then move rapidly up to complete the impulse wave 5 and reach support area at around 3.1350.
It had a strong upside movement last week, now it would be a time for a correction. Plus this arc shape fits well here.
What do you think?

NATGAS - Perfect double bottom - Price in Rising Channel.On the daily chart, NATGAS has formed a perfect double bottom, it's above the Daily 20, 50 and 100 EMAs. We are now contending with the 200ema.
Price on the 1 hour is in a rising channel.
Daily RSI and 1 Hour RSI above the 50 line, which is a bullish turning signal.
Seasonality and reduce production is on the bulls side.
Production hovering at 99.8bcf per day.
October contract rolls over to November soon.
La Nina is 80% chance for 2024/ 2025 winter, which should bring a stronger winter compared to the last 4 years.

Natural Gas: Weak Day / Strong WeekNatural gas had a bit of profit taking today and you can't blame the bulls for trimming especially since we did the same.
The Daily chart now needs a couple days of consolidation before another sustainable push.
The weekly chart recaptured the 50 Weekly MA...very good near term sign.
This can now be used as a support level to trade against for very tight stoploss swing traders.
As long as we remain above the breakout neckline we should be likely heading to retest 2.75 & $2.90
Levels below can cause nat gas to fail and fall substantially. Alway remembers the Weekly trend still has Lower highs in place.

NATGASU 12HIn a downtrend, a double bottom pattern has formed. Wait for the neckline breakout, and after receiving the necessary confirmations, you can achieve a good profit.

Natural Gas turning bullish? Natural gas has now cleared a major resistance zone and is looking poised to head higher.
We have a beautiful daily and potential weekly inverse head and shoulder pattern developing.
The micro daily chart bullish pattern has triggered and gives us another +8-10% of upside.
However the really juicy pattern is the potential weekly chart set up.
If we breakout of the $2.90-$3 range we have a massive potential move to the upside brewing.

Natural Gas continues to be green No change in the long idea in Natural Gas. Moving stops into trailing mode to lock in the profits.

Natural Gas / Bullish Up MovementLooks like Natural Gas forming a Head and Shoulders pattern on daily frame. There's a high probability the price go higher to 1st TP 2.50 and 2d TP 2.73.
Please, share your comment!

NG Daily Forecast As per study today NG will Remain Down, Based on Fundamental and technical analysis.
Pl See the Chart for Short entry and Target!! !
All the best

Short Natgas to 2007There is a clear oversupply and weakened demand for Natgas and now the hurricane is reducing LNG distribution.2007 is the target as a low support on the daily and just above the big round number. Estimate to hit this week.

Natural Gas Daily ForecastIt Seem , NG Will Take Small Correctional before heading to Big Move, As Per Elliot Wave it can be corrected up to 50% of current trend i.e. 2.26 USD Range .
Divergence are also visible , to confirm protentional reversal from hear.

Natural gas, Reversal / on 1h There is a high probability the price reverse from this resistance area. The chance is high that the market may release the liquidity again the moving the price lower.
Good luck!

Follow up on Natural GasWe go the pro-Trading System Trax green buy signal and we are nicely in profit. Time to trail our stop and get a free trade. If we can break 2378 then we could explode higher. Open profit target.

Natural Gas, channel break attempt Natural gas is moving in an ascending channel and look like attempting to break through resistance. I expect that the price may drop below the lower line of the pattern and do 5 steps model towards 1.60 -1.40 area.
SL 2.40 ; tp1 2.05; tp2 1.80; tp3 1.60
Share your opinion!

Natural Gas (XNGUSD): Back to Bullish Trend?!The XNGUSD pair is showing signs of recovery following a prolonged period of bearish movement, the pair is currently trading in an expanding wedge pattern.
A bullish breakout of a significant daily resistance level has been confirmed, with the broken level now acting as support.
This indicates strong buying pressure. I anticipate further recovery in the market, with a potential move towards the 2.18 area in the near future.

Natural Gas (XNG/USD)Overall Bias: Bearish with potential for a short-term bounce
Key Observations:
1. 1-Month Chart:
• Price Action: The long-term bearish trend is still intact. The price peaked at $9.177 and has since declined to the current level near $2.066.
• Support Levels: Major support is around $1.59. A break below could lead to a further drop.
• Resistance Levels: The resistance at $4.641 is a significant level that will likely cap any upside in the medium term.
• ATR (Volatility): With an ATR of 2.000, we can expect sharp price movements.
2. 1-Week Chart:
• Price Action: Natural Gas has broken below key support levels. The most recent candle shows price stabilizing near $2.066 after a significant drop.
• Support Levels: $1.60 is key weekly support.
• Resistance Levels: Significant resistance is around $4.641 (Fibonacci 0.236 level). The next resistance lies at $3.722 (Fibonacci 0.382).
• RSI: At 30.93, the RSI indicates that the market is near oversold territory, hinting at a potential bounce.
• MACD: Weekly MACD remains bearish, indicating downside momentum.
3. 1-Day Chart:
• Price Action: The price has tested a low of $1.591 and bounced back to $2.066. The price is currently trading below significant moving averages, showing weakness.
• Support Levels: Immediate support is $1.55. Below this level, there is not much support until $1.460.
• Resistance Levels: $2.639 (0.236 Fibonacci) is key resistance on the daily chart. Above this, $3.00 would be a psychological level.
• RSI: RSI at 39.41 is nearing oversold territory, indicating the possibility of a bounce.
• MACD: The daily MACD is bearish, though the histogram suggests the selling pressure might be easing.
4. 4-Hour Chart:
• Price Action: The 4-hour chart shows Natural Gas has formed a bottom near $1.55 and is now attempting to bounce. However, the price is still in a lower high/lower low structure.
• Support Levels: Immediate support is $1.555, which aligns with previous lows.
• Resistance Levels: The short-term target is $2.639, a key Fibonacci retracement level.
• RSI: At 48.60, the RSI is neutral, showing that Natural Gas has some room for upside before becoming overbought.
• MACD: The MACD has slightly turned bullish on the 4-hour chart, suggesting that there could be some short-term upward momentum.
5. 1-Hour Chart:
• Price Action: The price is currently consolidating between $2.066 and $1.555. The 1-hour chart is showing early signs of a potential bullish reversal.
• Support Levels: Strong support is at $1.555. If the price breaks below this, it could test the lows near $1.460.
• Resistance Levels: Immediate resistance is $2.27. A break above this level could lead to a retest of the $3.00 psychological level.
• RSI: The RSI at 57.09 is approaching neutral-to-overbought levels.
• MACD: The MACD is neutral but shows slight bullish divergence, supporting the case for a short-term bounce.
6. 30-Minute Chart:
• Price Action: The price is showing signs of bottoming in the short term and could head towards $2.27 (recent high) before retesting support.
• Support Levels: Immediate support is $1.555, while $1.863 could act as a mid-term support level.
• Resistance Levels: If the price can break above $2.27, a retest of $2.66 is likely.
• RSI: At 62.96, the RSI is nearing overbought conditions, which could suggest a minor pullback or consolidation before a further upward move.
• MACD: The MACD on the 30-minute chart has turned bullish, supporting short-term upward movement.
Trading Strategy:
Primary Bias: Bearish
• Short Position:
• Entry: Consider shorting near $2.27 (Fibonacci 0.764 level) if price shows resistance.
• Stop-Loss: Place a stop-loss above $2.66 (key resistance).
• Take-Profit Levels:
• First target: $1.863 (recent low support).
• Second target: $1.555 (strong support level).
Alternative Scenario: Short-term bounce
• Long Position (Speculative):
• Entry: If the price bounces from $2.066, consider a long position targeting the next resistance levels.
• Stop-Loss: Below $1.555 to limit downside risk.
• Take-Profit Levels:
• First target: $2.639 (0.236 Fibonacci).
• Second target: $3.00.
Risk Management:
• Position Sizing: Due to high volatility (ATR of 2.00), keep position sizes smaller than normal to manage risk.
• Stop-Loss: Ensure stop-losses are placed carefully, especially near support/resistance levels to avoid being stopped out by volatility.
Conclusion:
Natural Gas is currently trading near significant support levels, but the overall trend remains bearish. A short-term bounce could occur, especially if the price holds above $2.066, but the bearish momentum suggests the longer-term outlook remains to the downside. Any upside is likely to face resistance at $2.66 and $3.00. For now, shorting near resistance zones around $2.27 could be the favorable trade, while taking advantage of a potential bounce for short-term gains is also viable for more aggressive traders.

Natural Gas: Bearish OutlookNatural Gas: Bearish Outlook
Technical Analysis:
The price of natural gas recently completed a “Rising Wedge Pattern” near the 2.2960 level, increasing the likelihood of a bearish wave.
The geopolitical situation remains highly unstable, causing frequent price fluctuations.
In the past few hours, the price has dropped by approximately 3.35%, and it is expected to decline further to the 2.1760 and 2.100 levels.
You may find more details in the chart!
Thank you and Good Luck!
❤️PS: Please support with a like or comment if you find this analysis useful for your trading day❤️

Natural Gas waking up? Nat gas showed some poise today.
Holding green in a red market where most commodities saw negative price action.
This is impressive to see because Nat gas has a long historical trend of diverging from many commodities.
The price action today also saw a red to green reversal further emphasizing the positive potential trend shift.
Nat gas stocks were discounted today despite the stronger price action in the commodity.
We remain bullish and long UNG, our call positions in the money.

Waiting for NaturalGas to rise. H4 30.08.2024Waiting for NaturalGas to rise
Gas tried to break down to 2.00 twice and bought back twice.
And large volumes are now around 2.10 and defending.
If they are not pushed down, they may rise to the upper boundary of the flat to 2.30 and even 2.50.
Increased vertical volumes came in at the moments of buyback, which often coincides
with the culmination and turns the market.

NATGAS - NEW BEARISH MOVEHi Traders !
Previously, The NATGAS formed a head and shoulders pattern.
The NATGAS reached the neckline and failed to break it,
At the moment, The last higher low is broken !
So, I predict a new bearish move📉
_____________
TARGET: 1.974🎯

XNG/USD "NATURAL GAS" Robbery plan in Long SideHola ola My Dear,
Robbers / Money Makers & Losers,
This is our master plan to Heist XNG/USD "NATURAL GAS" Mines based on Thief Trading style Technical Analysis.. kindly please follow the plan I have mentioned in the chart focus on Long entry. Our target is Red Zone that is High risk Dangerous level, market is overbought / Consolidation / Trend Reversal at the level Bearish Robbers / Traders gain the strength. Be safe and be careful and Be rich.
Note: If you've got a lot of money you can get out right away otherwise you can join with a swing trade robbers and continue the heist plan, Use Trailing SL to protect our money.
Entry : Can be taken Anywhere, What I suggest you to Place Buy Limit Orders in 15mins Timeframe Recent / Nearest Swing Low
Stop Loss : Recent Swing Low using 2h timeframe
Warning : Fundamental Analysis comes against our robbery plan. our plan will be ruined smash the Stop Loss. Don't Enter the market at the news update.
Loot and escape on the target 🎯 Swing Traders Plz Book the partial sum of money and wait for next breakout of dynamic level / Order block, Once it is cleared we can continue our heist plan to next new target.
Support our Robbery plan we can easily make money & take money 💰💵 Follow, Like & Share with your friends and Lovers. Make our Robbery Team Very Strong Join Ur hands with US. Loot Everything in this market everyday make money easily with Thief Trading Style.
