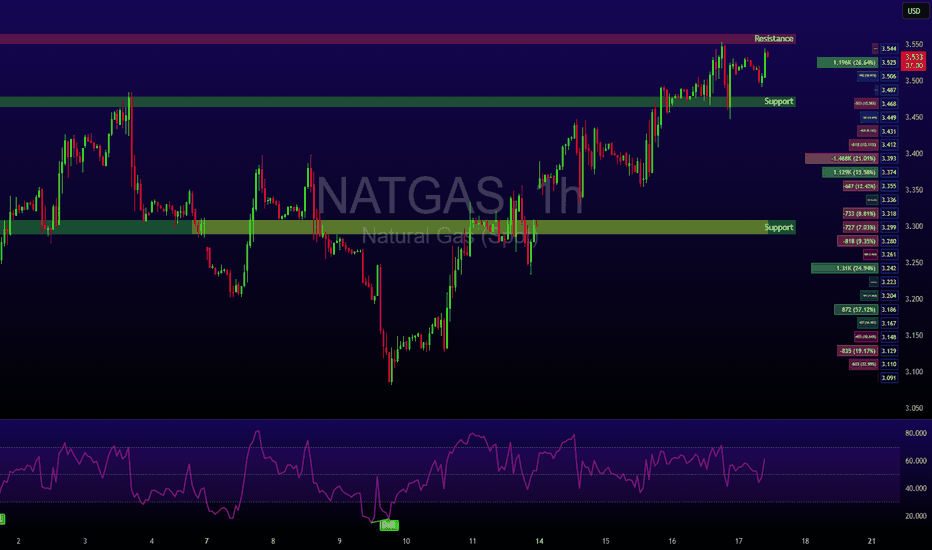
Heatwave Fuels Breakout as Fundamentals AlignNatural Gas has reclaimed the spotlight with a sharp move above $3.56, breaking through a key resistance level as a heatwave grips large parts of the United States. With above-average temperatures forecast to persist into late July, demand for cooling remains elevated, significantly boosting power consumption across the board.
Supply remains tight despite elevated production levels. Liquefied Natural Gas (LNG) feedgas volumes are rising as export demand holds strong, keeping domestic stockpiles in check. While some temporary relief in demand could arrive next week, the broader outlook remains bullish. Weather models suggest persistent heat, and traders are increasingly positioning for sustained tightness in the balance of supply and demand.
Technical Setup:
• Key level breached: $3.48 (100-day EMA) decisively broken
• Current price zone: Approaching $3.57, the next major pivot
• Momentum: If bulls secure a weekly close above $3.57, the market could enter a longer-term uptrend with $3.65 and $3.80 in sight.
Takeaway: Natural gas traders should monitor weather patterns and storage data closely. Sustained heat could keep the rally intact, but short-term pullbacks may offer entry points for trend-followers.
NGSUSD trade ideas
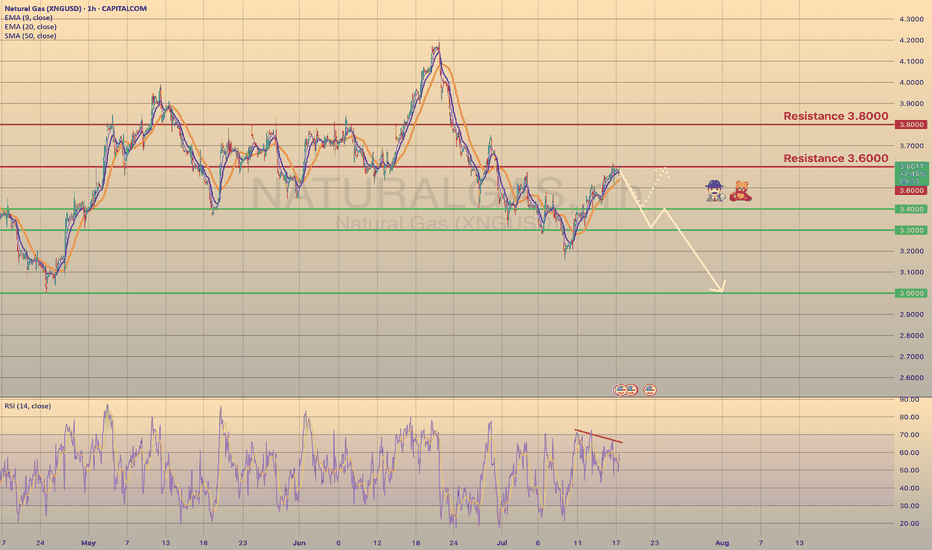
U.S. NATURAL GAS - BEARISH DIVERGENCE DETECTED
U.S. NATURAL GAS - BEARISH DIVERGENCE DETECTED🕵🏻♂️
The Natural gas has been trading bullish for 7 days in a row since last Wednesday, reaching the 3.6000 resistance level. Primarily this happened due to a warm weather in the U.S. states, that supports the demand on gas. Despite warmer-than-normal summer weather, analysts expect energy firms to inject more gas into storage than usual in coming weeks. Record-high output in June, likely to be surpassed in July, and reduced gas flows to LNG export plants since April's peak, support this trend.
Technically chart shows us a bearish divergence on 1-h timeframe. I suppose the price to slowly decline towards major support level of 3.0000 with minor rebounds. The 2nd option is the rebound from 3.4000 support level with a first target of 3.6000.
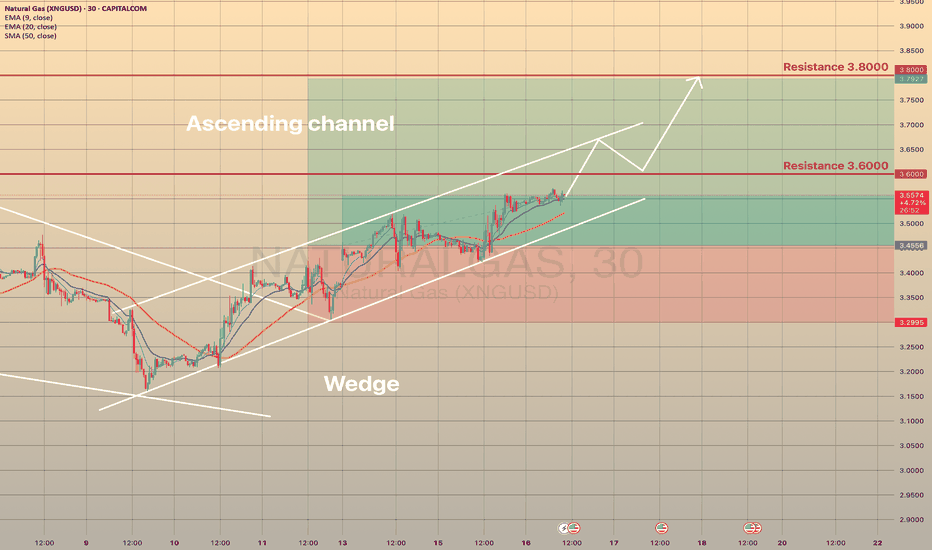
NATURAL GAS - STILL IN THE GAME TRADING IDEA UPDATE -
NATURAL GAS - STILL IN THE GAME🔥
The XNGUSD goes quite well, as predicted. It held the trendline and moving upwards slowly, but surely. Short-term support here is the EMA20 on 4h timeframe. The asset is just below 3.600 resistance level and sma200. Since the July 10, the asset seems to be moving within the ascending channel (pic 2). I expect that the price will break the 3.6000 resistance level, will go towards upper channel border and then, after quick retest, move towards 3.8000. Not a trading advice! Trade cautiously!
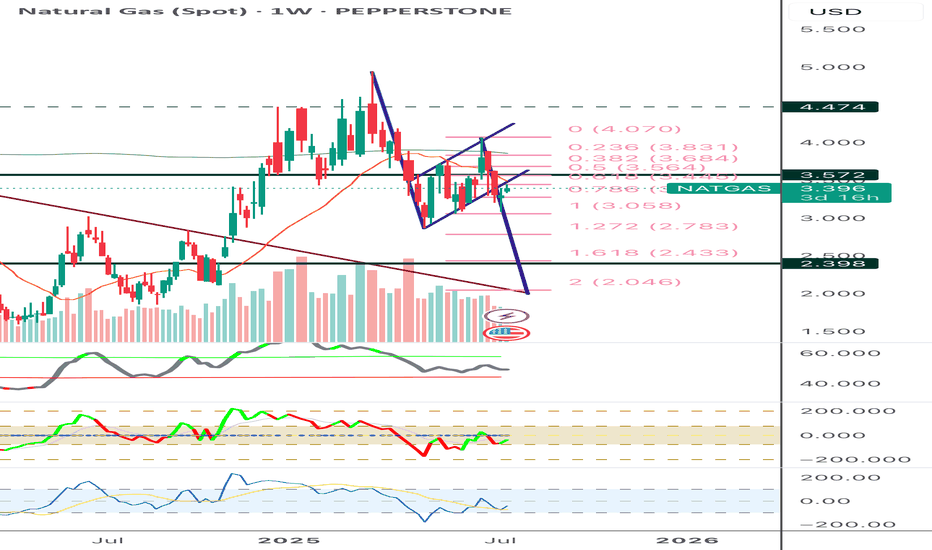
Natural Gas Spot Well trying to read this complex correction again and assuming this is larger x wave or f wave if diametric in intermediate degree and time confirmation yet to come if next high previous fall not passed with in that time, then new low again possible, Let see. Not a sebi registered analyst, just personal view
NATURAL GAS - REBOUND FROM THE MAJOR TRENDLINE AND ANOTHER LONG CAPITALCOM:NATURALGAS
Last week on Wednesday and Thursday we observed the false breakout of the major trendline. Eventually, Thursday ended up bullish, gaining 4.8% day-to-day. On Friday the asset has been trading majorly sideways, retesting the major trendline (pic 1). Technically, looks like the divergence on RSI, MACD and Momentum works out as well as the bullish wedge (pic 2). Fundamentally, we still have warm temperature weather forecasts in the U.S. and bullish Thursday's EIA report. Additionally, today the market opened with a bullish gap and continues to grow, which is a good signal for the buyers.
Considering major levels here, I decided to open long positions:
🔼 a market buy order at 3.4556 with
❌a stop loss at 3.2995 and
🤑a take profit at 3.7927
At 3.6000 would be reasonable to reduce long position on a half. Thank you for the attention!
Natural Gas is in the Buying DirectionHello Traders
In This Chart NATGAS HOURLY Forex Forecast By FOREX PLANET
today NATGAS analysis 👆
🟢This Chart includes_ (NATGAS market update)
🟢What is The Next Opportunity on NATGAS Market
🟢how to Enter to the Valid Entry With Assurance Profit
This CHART is For Trader's that Want to Improve Their Technical Analysis Skills and Their Trading By Understanding How To Analyze The Market Using Multiple Timeframes and Understanding The Bigger Picture on the Charts
Potential Scalp Bearish Reversal Natural GasHello fellow traders, I will be giving my daily trade setups. I will be focusing day trading and scalping opportunities. I would like these posts to help others. Risk management is key.
Natural Gas appears to have made a bearish reversal divergence. Looking to short the bearish engulfing. I will be looking for a 2% drop down the 3.20, which is a previous support.
XNGUSD rebounded after tested the accending supportFundamental view:
Total US natural gas consumption rose 0.8% to 75.1 Bcf/d. Power sector demand increased 1.0% to 43.8 Bcf/d, driven by higher temperatures and increased air conditioning use. While total supply averaged 112.5 Bcf/d, down 0.6% from the previous week. Dry production decreased 0.6% to 106.2 Bcf/d. Net imports from Canada fell 1.4% to 6.3 Bcf/d. Rig count for natural gas fell by 1 to 108 rigs, indicating a slight reduction in drilling activity.
As a result, the working gas underground continued to increase above the 5-year average, nearly reaching its highest level in 5 years.
However, the higher-than-expected temperature and the demand from the EU, ASIA countries could support the price in the long term.
Technical view:
XNGUSD rebounded to $3.39/MMBtu on July 11, 2025, up 1.45% from the previous day, but is down 3% over the past month. Prices remain 45% higher year-over-year, reflecting a strong medium-term uptrend.
The price is consolidating above $3.20–$3.25 support, with a descending wedge pattern forming—often a precursor to a bullish reversal. The 100-period SMA is below the 200-period SMA, confirming a bearish bias, and the price is trading below both. The Stochastic Oscillator is oversold, and RSI is near technical bounce territory, but both indicate lingering bearish momentum.
A breakout above the wedge and the 100/200 EMA resistance, especially above $3.60, could trigger a rally toward $3.80 or even $4.00. Oversold momentum indicators and potential seasonal demand spikes could support this move.
Failure to hold $3.20–$3.25 support or persistent rejection at EMA resistance could push prices to $3.00 or even $2.70. Bearish momentum, increased inventories, or weak demand would reinforce the downside.
Technical Analysis of USNATGAS Downtrend
Trend Identification:
The price is making lower highs and lower lows, classic signs of a downtrend.
Moving averages (e.g., 50 EMA below 200 EMA) confirm bearish momentum.
Price often stays below key resistance levels such as previous support turned resistance or Ichimoku Kijun line.
Volume & Momentum:
Volume typically spikes on down moves, indicating strong seller participation.
Momentum indicators like RSI may be below 50 or approaching oversold territory, confirming bearish pressure but allowing room to fall further.
Resistance and Support Zones:
The stop loss at 3.600 is placed just above a recent swing high or resistance zone, protecting against a breakout reversal.
The take profit at 3.090 targets a previous significant support level or a Fibonacci retracement zone where price may find buying interest.
Risk-Reward:
The difference between entry and SL (~0.510) vs. entry and TP (~0.510 or more depending on entry) gives roughly a 1:1 or better risk-reward ratio, essential for disciplined trading.
Additional Confirmation:
Indicators such as MACD could show bearish crossovers.
Ichimoku Cloud may show price below the cloud, with the Senkou Span A below Senkou Span B (bearish cloud).
RSI not yet oversold, suggesting the downtrend may have more room.
Summary
Entry: Short USNATGAS around current price levels below 3.600 resistance.
Stop Loss: 3.600 (above recent resistance to avoid premature stop-outs).
Take Profit: 3.090 (near prior support or technical target).
Gas Market: Short-Term Stability vs. Long-Term TensionCAPITALCOM:NATURALGAS MCX:NATURALGAS1! NYMEX:NG1! PEPPERSTONE:NATGAS
This analysis was prepared by Dr. Igor Isaev in cooperation with Anastasia Volkova, analyst of LSE.
The natural gas market presents a mixed outlook as we enter Week 28. Last week, Summer 2025 contracts traded slightly above their median pre-expiry levels, staying within historical volatility ranges since 2010. Winter 2026-27 contracts held firmly above the upper bounds of the 10-day pre-expiry band, signaling persistent concerns over supply and weather-related risks. Analysts expect prices to stabilize in the near term, but the forward curve tells a different story. While 2025 contracts with three-year delivery terms have aligned with 2023-2024 prices for similar terms, a significant skew persists in short-term (1-2 years) and long-term (5-6 years) tenors compared to 2020-2024 benchmarks, hinting at underlying structural uncertainty.
Fundamentals show signs of stabilization. For Week 27 (June 28 - July 3), storage injections rebounded to +63 billion cubic feet (BCF), pushing inventories above the five-year median. Injection rates recovered from last week’s dip, and if current supply and demand conditions hold, we could see 2024 peak storage levels. Yet, weather and seasonal factors in the second half of summer pose a limiting challenge. NOAA data indicates a gradual weather stabilization: Week 28 remains hot compared to the past 30 years, but forecasts predict a return to the median by Week 29.
The accompanying graph (Right lower graph) highlights this trend, with candlesticks showing quantiles from 1994 to 2024—red dots for 2024, green for 2025, and blue for 2025 predictions. Regionally, this stabilization pattern holds across nearly all areas.
Despite these gains, the supply-demand balance lags behind historical norms. In Week 28, the net difference between supply and demand remains well below the median for 2014-2024, suggesting that short-term calm masks deeper imbalances. The afterword underscores this tension: while storage growth and weather normalization offer relief, the forward curve’s divergence reflects market unease about systemic risks—be it policy shifts, infrastructure issues, or long-term demand volatility. For now, sentiment stays cautiously neutral, supported by recent injections but shadowed by unresolved signals farther out.
NATURAL GAS formed Head and Shoulders patternCAPITALCOM:NATURALGAS
🔍 From a longer-term perspective, I noticed that a Head and Shoulders pattern 🪖🩻 is about to form. This pattern has been forming since December 2024 and in the long term 🕰️ means no good for those who play long here 📉.
🙋♂️ Personally, I will stay aside for now and observe 👀. The asset may head towards the 3.0000 support level 🪙, where I expect a potential rebound 🔄, possibly even a retest of the trendline from below ↩️.
⏳ In the long term, the asset may even move towards the 2.0000 support level 🚨, but I will need more observation and data to be sure 🧪.
🕊️ Time will show. Thank you for the attention! 🙏
XNGUSD POSSIBLE LONG OPPORTUNITY
Us natural gas has been falling since June 20th and stopped a decline nearby the 3.3900 level with minor false breakouts of it. Currently we observe the reversal bullish wedge pattern, which is supported by a divergency on rsi on 4-h timeframe. Yesterday natural gas trading session opened with a gap downside, however, later, closer to the American session we observed buying volumes and the asset managed to hold above the 3.3900, which makes it interesting to go long.
If the price breaks above the MA50 at 3.4824, would be nice to set a
🔼buy stop order at 3.5144 with a
💰take profit at 3.8000 and a
❌stop loss at 3.2494, below the trendline.
The risk-reward ratio is 1:1.08.
Waiting for $3: Patience Before Positioning in GasYes, the attempt to catch the bottom in natural gas ended in failure. Let it be a lesson for the future. Just because something looks cheap and low doesn’t mean it can’t go even lower — and the question is whether your margin and nerves can handle the drawdown. In short — it's a bad path.
It’s too late to short, too early to go long.
I think we’ll most likely head toward the $3 level, and from there we’ll see: will it break or hold? Ideally, I’d like to wait for a proper long setup at that level.
Operation Gas Leak: Bearish Swing in XNG/USD🧨XNG/USD Energy Vault Playbook: Natural Gas Power Grab!⚡💸
🌟Hi! Hola! Ola! Bonjour! Hallo! Marhaba!🌟
Dear Market Raiders & Strategy Hustlers 🕵️♂️📊💼
Welcome to the 🔥Thief Trader Energy Strategy🔥 for XNG/USD (Natural Gas) – our tactical plan for smart intraday & swing moves based on technical, fundamental, and sentiment fusion.
💼This setup focuses on short-side scalps & swing entries, with a target to lock profits around the high-risk Green Zone before the market guards show up. Resistance zones are hot – expect consolidation, pressure buildup, and possible shakeouts.
🔑 Entry:
📍Plan smart pullback entries on 15–30 min TF near swing high/low zones.
🎯“The vault is open”—watch the market for weak bounces or fakeouts to ride the move.
🛡️ Stop Loss:
📌Primary SL is the most recent swing high on the 4H (around 3.600)
🔧Adjust based on risk tolerance, lot sizing, and how deep your stack of trades runs.
💥 Target:
🎯 Aim for 3.200 – a clean technical pivot where past price action has shown tension. Perfect spot to secure the bag.
🧲 Scalping Strategy:
🦅Short bias only. Stay light, stay fast. Use trailing SLs and don’t overstay your welcome. Let the swing crew do the heavy lifting.
🔍Market Narrative:
📉 Currently biased bearish, Natural Gas is facing pressure from:
Macro fundamentals
Seasonal distortions
Inventory & storage levels
COT report & Sentiment
Intermarket signals
📊Stay aware of news events – they’re known to rattle price structures. Set trailing SLs and manage your exposure wisely.
💬Final Words from the Thief Playbook:
💣Boost your strategy, not your stress. Let’s outsmart the market makers with sharp entries, sniper exits, and disciplined risk. 🚀
🔥💖Smash that LIKE if you vibe with this Energy Heist Plan. More tactical drops coming soon, so stay alert! 🧠📈🐱👤
Natural Gas is in the Buying DirectionHello Traders
In This Chart NATGAS HOURLY Forex Forecast By FOREX PLANET
today NATGAS analysis 👆
🟢This Chart includes_ (NATGAS market update)
🟢What is The Next Opportunity on NATGAS Market
🟢how to Enter to the Valid Entry With Assurance Profit
This CHART is For Trader's that Want to Improve Their Technical Analysis Skills and Their Trading By Understanding How To Analyze The Market Using Multiple Timeframes and Understanding The Bigger Picture on the Charts
NGAS 1:5Natural gas production (95 Bcf/d, +0.5 Bcf/d compared to the previous week) continues to increase.
LNG exports (12.5 Bcf/d) rose slightly (+0.3 Bcf/d).
Weather conditions (HDD/CDD) reflect neutral demand: moderate heating demand (HDD = 450), weak cooling demand (CDD = 120), without any storm threats. The absence of extreme weather conditions leaves the market without short-term bullish impulses.
The COT report (Managed Money) as of July 1, 2025 (published July 4) is currently the most significant factor. Net-short positions increased by 45k contracts, totaling 220k contracts, substantially exceeding the threshold signal level of 30k contracts. Historically, such an increase in short positions has resulted in falling prices.
Thus, from a fundamental perspective, despite the moderate positivity of inventories and LNG exports, the key factors dominating the market remain increasing production and extremely bearish sentiment in the COT report.
Technical Analysis:
A clear descending wedge and bearish flag are forming. The downside breakout of the 3.38 level, followed by a retest, confirms the bearish structural scenario. Each upward bounce is accompanied by a noticeable increase in selling volume.
Stop loss: 0.9%
Risk/Reward ratio (R:R):
1:5 — very favorable.
I will begin to consider LONG positions only upon a confirmed rebound from the levels 3.22 and 3.05.
Weather Factors and Storage Levels Across the AtlanticCAPITALCOM:NATURALGAS MCX:NATURALGAS1! NYMEX:NG1! PEPPERSTONE:NATGAS
Current prices vs. price spread 10 days before expiry by month since 2010. The 2025 summer futures contracts are still trading above the median expiration price, but remain within the interquartile range. Winter 2026 contracts declined relative to the previous week but remain higher than 2025, similar dynamics are observed in 2027. The market is slowly but still starting to stabilize.
Current Forward curve compared to 2020—2024. A strong upward bias in the curve remains in 2025 despite the price decline last week. The shape of the curve after 2027 remains more stable, and the decrease in outright contract prices has not altered it. It stays within a price range comparable to the corresponding 2023-2024 curves for the same period of the year.
Current gas inventories and next week's forecast compared to 2019—2024. For the 26th week (June 21-27), we anticipate a 45 BCF increase in storage. The level of filling will be above the median for the previous 5 years. Despite falling pumping rates, if the current supply and demand situation persists, the 2024 peak level is possible. The weather in the 2H of summer remains a constraint.
Weekly HDD+CDD totals from current NOAA data and forecast for the next two weeks compared to 1994—2024. HDD+CDD values in the first half of June were below the median. Week 27 (June 30—July 6) is expected to remain comparatively hot, relative to the last 30 years. The forecast values for week 28 are on the upper quantile.
Weekly cumulative supply/demand difference vs. 2014—2024. If we take a look by region, we can see forecast values for the current and following week above average in almost all regions.
Change in monthly weather averages for 10 years from 1990 to 2024. Over the past 30 years, July has become hotter by 20 HDD+CDD units.
Weekly cumulative supply/demand difference compared to 2014-2024. The April-June 2025 supply/demand balance is well below the 10-year median due to low temperatures in the 1H of summer. The last two weeks have seen a trend reversal towards a higher balance above the historical median. At the same time, due to production growth over the last week, we are monitoring whether the increased demand from consumption will be offset by production growth.
Percentage change in Spot and near-term futures price relative to the beginning of the year for 2010-2025 by month. Across 15 years of carrying out statistics, July spot and near-term futures became traded with minimal price divergence.
A bullish Case for Natural GasFor natural gas, I’m expecting the price to rise to higher levels. The initial target is 4.20, and the global goal is the previous high of 4.90. The price is currently rising from the support level of 3.36.
A stop loss set at 3.35.
The asset is highly volatile, with a stop loss of almost 4%. Therefore, when entering positions, assess the risks and the potential capital involvement.
The key in trading is to protect your money first. Making profits comes second.
LNG Bull Market: How Geopolitics and Demand Are Fueling XNG🔥 The Natural Gas market presents a compelling risk/reward opportunity with strong fundamental support from ⚖️ supply/demand imbalances and 🌍 geopolitical factors. The technical chart shows a healthy 📊 consolidation after the explosive 🚀 February–March rally, with the potential for another leg higher.
📌 Key Investment Thesis:
• 📈 Structural bull market driven by demand growth outpacing supply
• 🌐 Geopolitical premium supporting price floor
• 🌦️ Weather-driven volatility creating trading opportunities
• 🛳️ LNG export growth providing long-term demand foundation
🧭 Recommended Approach:
• 💰 Accumulate positions on weakness near $3.00–$3.40 levels
• 🎯 Target initial resistance at $4.00, with extended targets at $5.00+
• ⚠️ Maintain disciplined risk management with stops below $2.60
• 👀 Monitor weather patterns and geopolitical developments closely
📊 Risk Rating: MODERATE TO HIGH (due to volatility)
💵 Return Potential: HIGH (⏫ 50–100% upside potential over 12–18 months)
❗ This analysis is for informational purposes only and should not be considered as financial advice.
⚠️ Natural gas trading involves significant risk and volatility.
📚 Always consult with a qualified financial advisor and conduct your own research before making investment decisions.
NATURAL GAS (NATGASUSD): Bullish Outlook Explained
Natural Gas is trading in a mid-term bullish trend on a daily.
The price updates higher highs and higher lows after each
test of a rising support line.
Its last test made the market form a strong rejection first
and a bullish engulfing candle then.
The market may continue growing and reach at least 3.7 resistance soon.
❤️Please, support my work with like, thank you!❤️


