NATGAS - Long Opportunity with a H&S TF 15 minThere is a H&S configuration.
We have to break the neck line.. if is will happen, we can have a new long wave until area 4.2
NGSUSD trade ideas

NATGAS is Bearish amid Oversold SignalsFenzoFx—NATGAS is in a downtrend, broke below the $3.66 support. The primary trend is bearish, but a consolidation phase is expected.
In this scenario, Natural Gas may test the 50.0% Fibonacci retracement level at $3.866 before the downtrend resumes. Watch this level for bearish signals, like candlestick patterns.
>>> Trade NATGAS without swap at FenzoFx Decentralized Broker

Natural Gas Faces Strong Sell-Off Amid Oil CrashNatural Gas Faces Strong Sell-Off Amid Oil Crash
Natural Gas (NG) has once again tested the 4.2 resistance zone, encountering a strong sell-off as sellers positioned themselves for better selling opportunities.
So far, NG has broken below another key support level, increasing the likelihood of further downside movement. This decline aligns with the sharp oil crash, which was fueled by OPEC+ comments on increasing oil production.
While the bearish wave in NG is still unfolding, its pace is slower than usual. However, the overall trend suggests that the price is moving in the right direction for further declines.
You can watch the analysis for further details!
Thank you and Good Luck!
❤️PS: Please support this analysis with a like or comment if you find it useful for your trading day. ❤️

Fiery Butterfly of Natural Gas Price in 2025. In the previous analysis, we predicted the natural gas price trends from 2022 to the end of 2024 using harmonic patterns, which turned out to be highly profitable .
Now, in this idea, we aim to forecast the price movement for 2025 Based on the harmonic patterns, it seems likely that gas prices will rise and reach the golden level of the Butterfly pattern before experiencing a significant drop.

Bullish correction before the dropBe careful the market may be setting a huge bear trap the volume in the market isn't matching the price action in the candles. My ideas and Analysis are located on the price chart I do not trade the news or any type of other speculation I trade pure price action I watch the candles I wait then I strike I am new to trading but I am focused on Strictly Natural Gas. I'm looking for a so-called countertrend trade to the broken weekly pivot and my overall biased is still bearish

NATGAS - Long Pull Back strategyBig H&S in creation but not completed... so the price at neck line have a reaction without breakout
There is possibility for a new long wave.

NATGAS - Head and Shoulder pattern? - SHORTI see a potential H&S pattern short in formation
It can be completed with break of neck line ..
Aggressive trade can be do with an entry and stop loss above the actual max.


Head and Shoulders Potential on the Daily Natgas ChartHead and Shoulders Potential on the Daily Natgas Chart.
If Production keeps coming online, could easily achieve this target.
Not to mention that winter 2025 is expected to be warm, similar to 2023 - 2024

Natural Gas is in the Buying DirectionHello Traders
In This Chart NATGAS HOURLY Forex Forecast By FOREX PLANET
today NATGAS analysis 👆
🟢This Chart includes_ (NATGAS market update)
🟢What is The Next Opportunity on NATGAS Market
🟢how to Enter to the Valid Entry With Assurance Profit
This CHART is For Trader's that Want to Improve Their Technical Analysis Skills and Their Trading By Understanding How To Analyze The Market Using Multiple Timeframes and Understanding The Bigger Picture on the Charts
NATGAS - Plan B If break of structure - shortNATGAS - Plan B If break of structure
If NATAGAS break support dynamic trend line we can have an accelation until a below support area at 3.1

NATGAS - long strategy for dump actionAfter a morning with a push down in the demand area we have a return of buy in this market. The final candle is a rejection of short so I expected a new long phase in the next days.

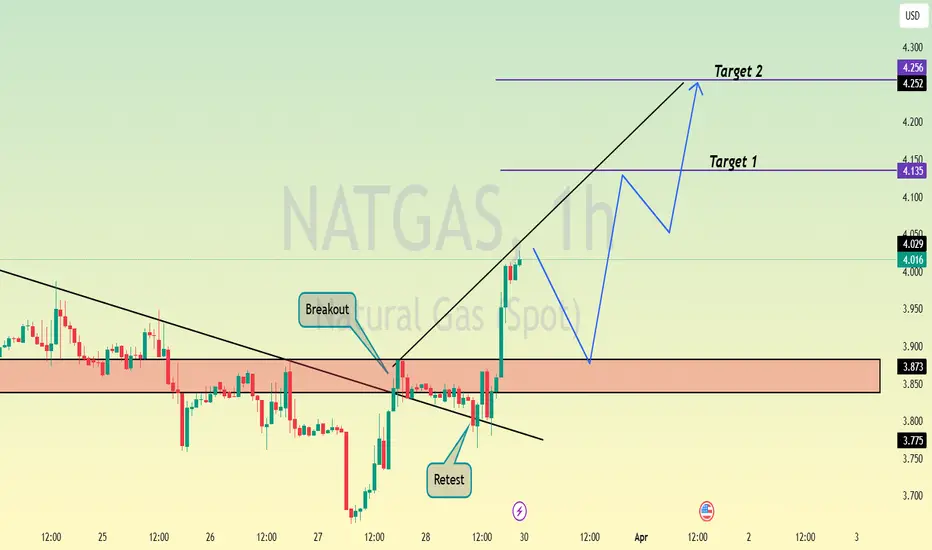
NATGAS Technical AnalysisFenzoFx—NATGAS broke above the trendline, surpassing $4.0, but is short-term overbought. It trades around $4.135, holding above the 50-SMA, with a bullish target at $4.26.
A drop below $3.906 (50% Fibonacci) could target $3.660 instead.

Naturalgas trend reversal Can buy as per the trade plan
Touched weekly support zone and reversing
Looking to buy on pullback on lower timeframe

NatGas Natural Gas LongPresident Trump´s tariffs on Russia, energy crisis ,and natgas cycle starting to motivate more buyers accumulationg their positions,going for higher prices.
Technically a profit taking time of the bulls is coming to an end.
Rockets:Buy/add more buys
2 variants:For more conservative traders, and those who have higher risk appetite.
Profit targets are the same.
The entries of both apporoaches are near and closed to strong midterm supports, therefor I have already taken this trades,as they promissing lower risk to me

XNG/USD Analysis: Natural Gas Price Drops to March LowXNG/USD Analysis: Natural Gas Price Drops to March Low
On 27 January, our analysis of the natural gas chart highlighted the formation of an ascending channel. Later, on 10 March, we noted that the sharp price increase had created technical conditions for a correction.
Since then, as indicated by the arrow on the XNG/USD chart, natural gas prices have declined by approximately 19%.
Why Is the Price of Natural Gas Falling?
- Unseasonably Warm Weather: Atmospheric G2 reported on Wednesday that forecasts now indicate significant warming across the eastern half of the U.S. from 31 March to 4 April. This could reduce demand for natural gas used in heating.
- Rising Inventories: According to the EIA’s forecast, weekly natural gas storage levels are expected to increase by +33 billion cubic feet over the past week.
Technical Analysis of XNG/USD Chart
Looking at the broader trend since the start of the year, the ascending channel (marked in blue) remains relevant. However, bears have pushed the price below its median line, shifting movement into a short-term downward channel (marked in red).
Currently, natural gas is trading near the $3.780/MMBtu level, a key price point that has previously acted as both support and resistance. Whether a bearish breakdown or a bullish rebound occurs largely depends on the upcoming EIA report, scheduled for release at 17:30 GMT+3.
This article represents the opinion of the Companies operating under the FXOpen brand only. It is not to be construed as an offer, solicitation, or recommendation with respect to products and services provided by the Companies operating under the FXOpen brand, nor is it to be considered financial advice.

Natural Gas: In a Clear Bearish Movement After CorrectionNatural Gas: In a Clear Bearish Movement After Correction
From our previous analysis, NG created a bearish correction that lasted for about 1 week and took place between 4 and 4.3.
After the pattern ended, the price fell by almost 13% in just 6 days.
News Today: Oil prices edged up on concerns about tighter global supply after U.S. tariff threats on Venezuelan oil buyers and earlier sanctions on Iranian oil buyers, while traders weighed the impact of U.S. President Donald Trump's auto tariffs.
You can watch the analysis for further details!
Thank you and Good Luck!
❤️PS: Please support this analysis with a like or comment if you find it useful for your trading day. ❤️
Previous Analysis:

NATGAS - NEW BREAKDOWNHello Traders !
On Monday 10 March, The NATGAS reached the resistance level (4.730 - 4.986).
Currently, The support level (4.368 - 4.218) is broken !
This key level becomes new resistance.
So, I expect a bearish move📉
______________
TARGET: 3.885🎯

NATGAS - Long strategyThis can be a good opportunity to ride the price in the next long phase.
Wa are on demand area after a short phase.
In any case we ca have an another short wave.. depends on global macroeconomy and Russia/Ukraina war.
So if thereisn't any drammaticaly change we can have a Long phase until 5$ and potential more..Fix your stop loss because in NATGAS all can change quikly.

My Daily $NGAS / $NG1! Idea Because of Absent Seasonal WeaknessSeasonal weakness in FX:NGAS / NYMEX:NG1! is absent so far but it could come into play if war-related concerns are fading with Putin and Ukraine set under "friendly pressure" to end this war.
Still, the gap between ending heating period and beginning demand for cooling is big enough to see a seasonal weakness period, imo.
It's just an idea. As always, do your own research. You are solely responsible for your trades.
Disclaimer
The information and publications are not meant to be, and do not constitute, financial, investment, trading, or other types of advice or recommendations

SWING NG (AGGRESSIVE)Last few days NG has been consolidating and correcting for a days, forming a bear flag pattern. Since it bounced off the bear flag resistance the main buy posiprice i am looking for is $3.91 where the price may retest liquidity and 200 MA (which is a major supp). Bullish engulfing candle is what I will be on the look for around 3.91. But I have my speculation, therefore my personal entry is set @$3.94
Alternatively if price breaks 4.33 then the pull back is the next likely position for a buy order. which will be above 4.33
Price 3.76 is a strong supp and also liquidity zone with tested FVG. This can be our stop loss but given the volatility of this future 3.68 would be the best SL.
I am expecting the price to test the bullish OB around 4.7 which is also out TP. For further extended move we will keep track of the price and see if it touches $5-5.2 range.
Lets hope that the Geopolitical influences are kept to a minimum by US/Russia/Ukr.

NATGAS | LONGWe have broken above a major resistance line on this timeframe. We did make a slight lower low on the 1H, but looking at the 4H we should expect a reversal around this range. showing signs of reversal, but having a pretty tight profit target considering the lower low.
4H:

Natural Gas - We touched the resistance, can we do it again?Hi guys, we are looking into a great commodity which just got traction in recent days.
1️⃣. Rising Global Demand
LNG demand is surging worldwide, particularly in Asia and Europe, as nations seek cleaner alternatives to coal and oil. With energy security concerns and geopolitical shifts, LNG is becoming a crucial component of diversified energy portfolios.
2️⃣. Cleaner Energy Alternative
Natural gas produces approximately 50% less carbon dioxide than coal and significantly reduces air pollutants. As governments and industries focus on decarbonization, LNG serves as a reliable bridge fuel toward renewable energy adoption.
3️⃣. Expanding Infrastructure and Market Growth
The LNG market is rapidly expanding, with new terminals, pipelines, and liquefaction plants being developed globally. Technological advancements are improving efficiency and lowering costs, making LNG more accessible and competitive.
4️⃣. Strong Economic and Trade Potential
LNG offers stable pricing mechanisms, long-term contracts, and increasing spot market opportunities. As more countries develop import capabilities, the LNG trade market is set to grow, providing investors with diverse entry points.
5️⃣. Energy Security and Geopolitical Importance
LNG helps countries reduce dependence on specific energy suppliers, improving energy security. The Russia-Ukraine conflict and other geopolitical factors have accelerated the shift toward LNG, boosting its long-term demand and investment potential.
Conclusion
LNG is positioned as a key energy source for the coming decades, balancing affordability, environmental benefits, and security. With strong global demand, technological improvements, and a transition toward cleaner energy, investing in LNG presents a strategic and forward-thinking opportunity.
Entry: 4.2150
Target: 4.6210
SL:3.9020
