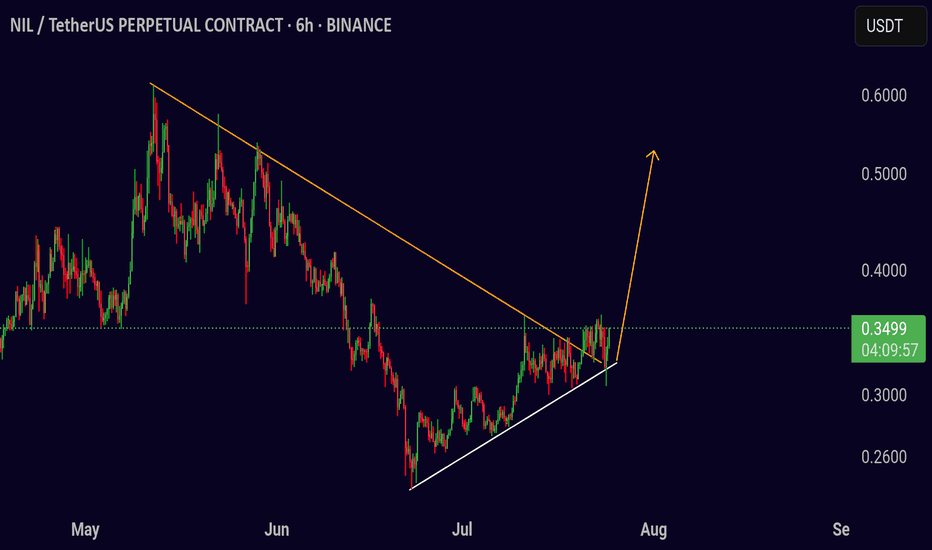
Trading Setup NILUSDT
Trading Setup:
A breakout is seen in the NIL/USDT pair (6h).
Price can move towards the following targets.
⬆️ Buy now or Buy on 0.3500
🛑 SL @ 0.3200
🔵 TP1 @ 0.3800
🔵 TP2 @ 0.4100
🔵 TP3 @ 0.4500
Risk Warning
Trading crypto, futures, and CFDs involves risk. Only trade with margin you can afford to
Related pairs
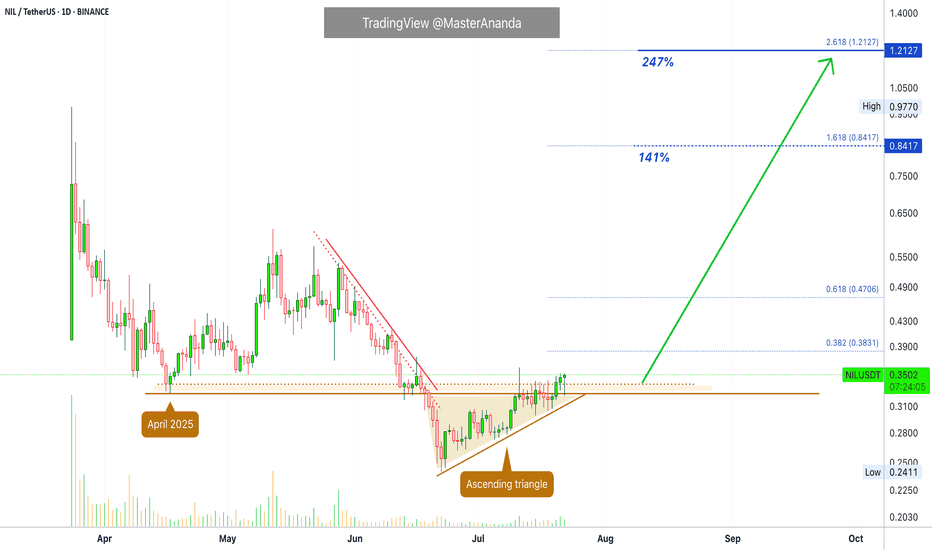
Nillion Token · Time Sensitive · Easy & Fast 247% ProfitsI am seeing many charts like this one with fully confirmed signals and ready to produce a strong advance exceeding 100-200% growth. The full move can develop within 2-6 weeks. Can be less if the action is very strong.
We are looking at Nillion Token (NILUSDT) on the daily timeframe. Our attention i
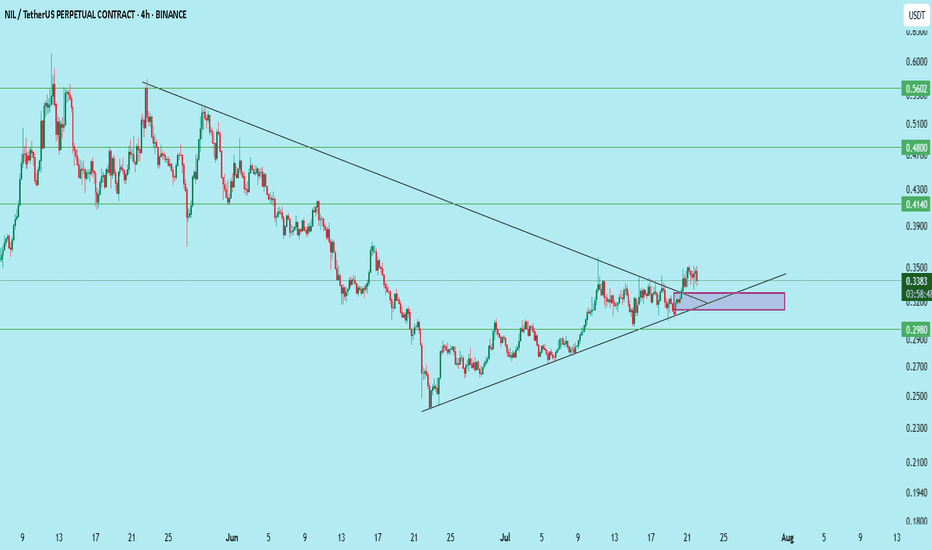
$NIL/USDT – Bullish Breakout Retest Setup (4H Timeframe)NIL has successfully broken its descending trendline and is now retesting the confluence zone of:
– Breakout support
– Ascending wedge
– Demand zone (rectangle)
Entry: 0.312–0.325
Stop Loss: Below 0.2971
Targets:
• 0.414 (+25%)
• 0.480 (+44%)
• 0.560 (+68%)
This is a textbook breakout–retest–conti
Nillion To Meet Final Resistance To Reach 273% —Trading BasicsNillion hit bottom 13-June but the bottom is only confirmed today with the current bullish breakout.
As the action turns bullish Nillion will grow to face its "final resistance" around $0.55. The good news is that this resistance level will break followed by additional growth.
Within the next 2 mo
Technical Analysis for NIL/USDT (1H Chart)The NIL/USDT pair is currently trading at $0.4662, showing signs of bullish momentum with a +4.06% gain in the latest hourly session.
A confirmed breakout above this previous high (HH) would signal a potential bullish continuation, targeting the next resistance around $0.5602. RSI is trending upwar
Nillion: Huge Long-Term Potential For GrowthThis one caught my attention and the project seems to be a good one, the concept behind it.
The chart here is very young so I am using a short-term timeframe, 4H.
(I will do a more thorough analysis once more data is available.)
The classic Adam & Eve (A&E) bottom formation is present on the char
NIL ANALYSIS (4H)The NIL correction started from the point we marked as Start on the chart.
This correction appears to be a Diametric, and it seems we are currently in wave E of this pattern. The price is expected to follow the path indicated by the arrow.
A daily candle close above the invalidation level will inv
NILUSDT Forecast: Anticipated Bearish Move AheadBased on the EASY Trading AI strategy analysis, NILUSDT currently demonstrates bearish sentiment. Our entry point is marked at 0.502 with projected targets indicating downward movement toward a Take Profit at 0.47033333. Protective Stop Loss is clearly defined at 0.54033333 to mitigate potential ris
See all ideas
Summarizing what the indicators are suggesting.
Oscillators
Neutral
SellBuy
Strong sellStrong buy
Strong sellSellNeutralBuyStrong buy
Oscillators
Neutral
SellBuy
Strong sellStrong buy
Strong sellSellNeutralBuyStrong buy
Summary
Neutral
SellBuy
Strong sellStrong buy
Strong sellSellNeutralBuyStrong buy
Summary
Neutral
SellBuy
Strong sellStrong buy
Strong sellSellNeutralBuyStrong buy
Summary
Neutral
SellBuy
Strong sellStrong buy
Strong sellSellNeutralBuyStrong buy
Moving Averages
Neutral
SellBuy
Strong sellStrong buy
Strong sellSellNeutralBuyStrong buy
Moving Averages
Neutral
SellBuy
Strong sellStrong buy
Strong sellSellNeutralBuyStrong buy
Frequently Asked Questions
The current price of Nillion / Tether US (NIL) is 0.3175 USDT — it has risen 3.31% in the past 24 hours. Try placing this info into the context by checking out what coins are also gaining and losing at the moment and seeing NIL price chart.
Nillion / Tether US price has fallen by −8.31% over the last week, its month performance shows a 16.02% increase, and as for the last year, Nillion / Tether US has decreased by −56.15%. See more dynamics on NIL price chart.
Keep track of coins' changes with our Crypto Coins Heatmap.
Keep track of coins' changes with our Crypto Coins Heatmap.
Nillion / Tether US (NIL) reached its highest price on Mar 25, 2025 — it amounted to 0.8680 USDT. Find more insights on the NIL price chart.
See the list of crypto gainers and choose what best fits your strategy.
See the list of crypto gainers and choose what best fits your strategy.
Nillion / Tether US (NIL) reached the lowest price of 0.2408 USDT on Jun 22, 2025. View more Nillion / Tether US dynamics on the price chart.
See the list of crypto losers to find unexpected opportunities.
See the list of crypto losers to find unexpected opportunities.
The safest choice when buying NIL is to go to a well-known crypto exchange. Some of the popular names are Binance, Coinbase, Kraken. But you'll have to find a reliable broker and create an account first. You can trade NIL right from TradingView charts — just choose a broker and connect to your account.
Nillion / Tether US (NIL) is just as reliable as any other crypto asset — this corner of the world market is highly volatile. Today, for instance, Nillion / Tether US is estimated as 5.30% volatile. The only thing it means is that you must prepare and examine all available information before making a decision. And if you're not sure about Nillion / Tether US, you can find more inspiration in our curated watchlists.
You can discuss Nillion / Tether US (NIL) with other users in our public chats, Minds or in the comments to Ideas.


