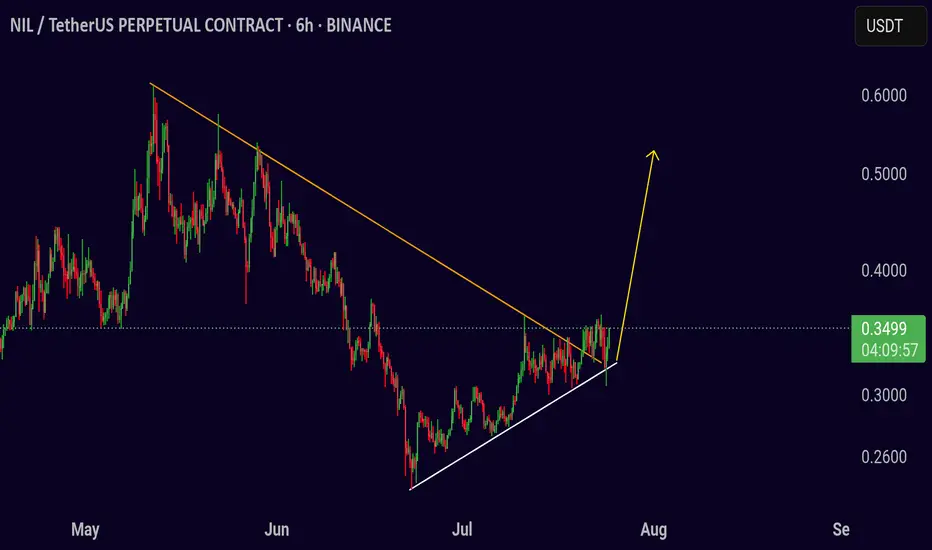
Trading Setup NILUSDT
Trading Setup:
A breakout is seen in the NIL/USDT pair (6h).
Price can move towards the following targets.
⬆️ Buy now or Buy on 0.3500
🛑 SL @ 0.3200
🔵 TP1 @ 0.3800
🔵 TP2 @ 0.4100
🔵 TP3 @ 0.4500
Risk Warning
Trading crypto, futures, and CFDs involves risk. Only trade with margin you can afford to lose. Past performance does not guarantee future results.
If you like this setup, support with a 👍 and share your thoughts.
NILUSDT trade ideas
Nillion Token · Time Sensitive · Easy & Fast 247% ProfitsI am seeing many charts like this one with fully confirmed signals and ready to produce a strong advance exceeding 100-200% growth. The full move can develop within 2-6 weeks. Can be less if the action is very strong.
We are looking at Nillion Token (NILUSDT) on the daily timeframe. Our attention is called to two signals mainly: (1) A low mid-April and (2) an ascending triangle.
The ascending triangle is a classic reversal pattern. Since this pattern is complete with the action moving above the mid-April low, we have a fully confirmed bullish bias. There is also the current candle with a long lower wick. Sellers started the day but the bulls are ending it on a high note.
The beauty of this chart setup lies in the risk and potential for profits. Very low risk because the signals are strong, and profits can come fast because the bullish move is already advanced.
Get in and get out. Easy chart, easy profits, easy win, easy trade.
Thanks a lot for your continued support.
Namaste.

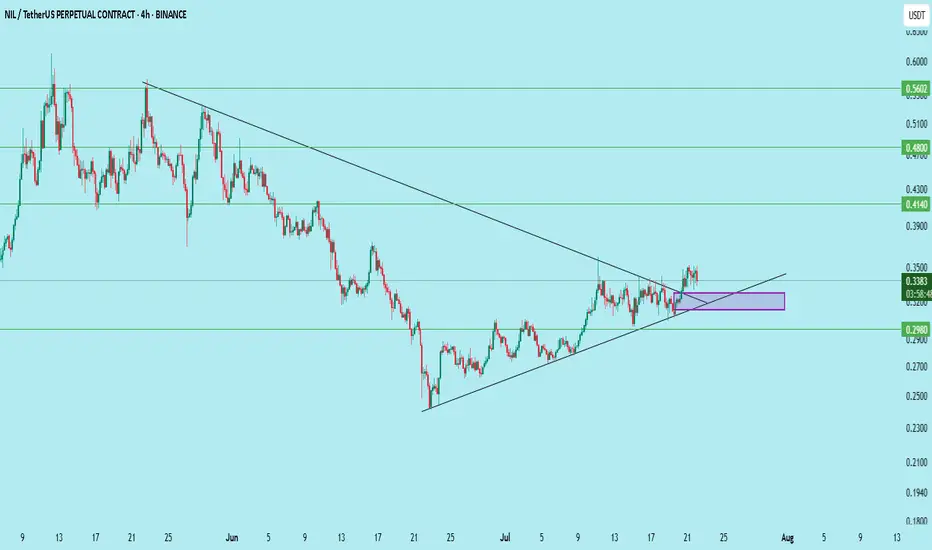
$NIL/USDT – Bullish Breakout Retest Setup (4H Timeframe)NIL has successfully broken its descending trendline and is now retesting the confluence zone of:
– Breakout support
– Ascending wedge
– Demand zone (rectangle)
Entry: 0.312–0.325
Stop Loss: Below 0.2971
Targets:
• 0.414 (+25%)
• 0.480 (+44%)
• 0.560 (+68%)
This is a textbook breakout–retest–continue pattern.
Spot buyers can scale in around the purple box.
Close below 0.2971 invalidates the setup.
DYOR. Not financial advice.
Nillion To Meet Final Resistance To Reach 273% —Trading BasicsNillion hit bottom 13-June but the bottom is only confirmed today with the current bullish breakout.
As the action turns bullish Nillion will grow to face its "final resistance" around $0.55. The good news is that this resistance level will break followed by additional growth.
Within the next 2 months, we have an easy target of 195% profits potential, followed by 273%. These are easy, and this means that NILUSDT will produce even more growth in the ensuing months. We will see an uptrend develop leading to a price discovery phase.
How far up this pair goes is a question mark because it is new, but total growth potential for this bullish cycle is huge. The fact that it is moving early is also good news.
Trading cryptocurrencies can be complex or it can be simplified, I like the simplified version; turn it into a waiting game, truly.
With a chart setup like this one, buy and hold, the market takes care of the rest. That's the waiting game but that's not all... You are waiting but once prices start to grow, you can enjoy the profits as they come. The next step will be to sell to secure a win. You only sell when prices are high, big green. Never sell when prices are low/red. Sell high. Buy low, sell high. Prices are low now.
Thank you for reading.
Namaste.

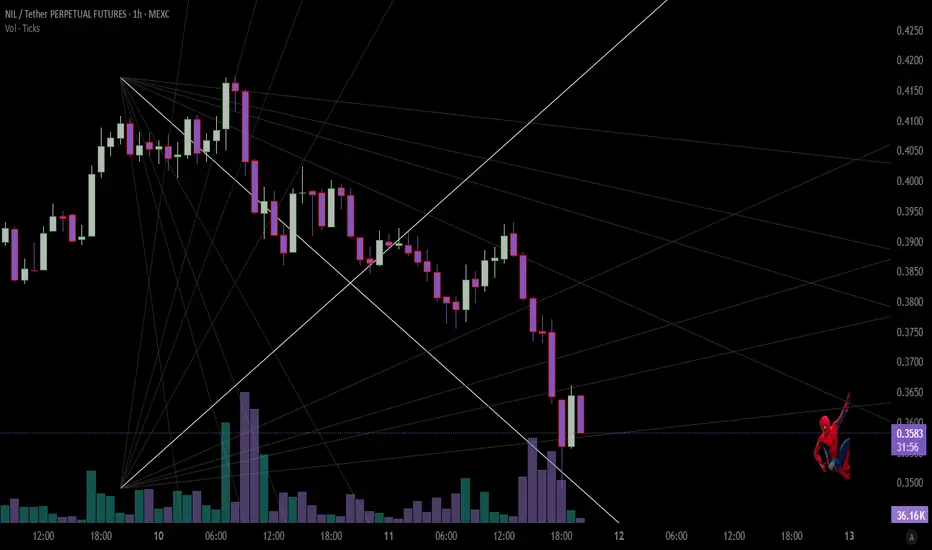
"Blind Trap Breakout"Wait for the web to stop shaking- or weave on your own.
Playing off the "blind computation" tech and the liquidity trap on the chart.
Technical Analysis for NIL/USDT (1H Chart)The NIL/USDT pair is currently trading at $0.4662, showing signs of bullish momentum with a +4.06% gain in the latest hourly session.
A confirmed breakout above this previous high (HH) would signal a potential bullish continuation, targeting the next resistance around $0.5602. RSI is trending upwards, currently at 45.89, suggesting building momentum.
If the price fails to break the HH level, it may continue to range within the current structure

Nillion: Huge Long-Term Potential For GrowthThis one caught my attention and the project seems to be a good one, the concept behind it.
The chart here is very young so I am using a short-term timeframe, 4H.
(I will do a more thorough analysis once more data is available.)
The classic Adam & Eve (A&E) bottom formation is present on the chart.
The action recovered above the 6-April low but it is still early for this pair, which can be good, a good opportunity for buyers. Buyers beyond.
There is still no high volume candles/session but growth has been happening for 10 days. This isn't much but lower prices are better than higher prices. Again, for buyers.
This can turn out into a good project. I see bullish potential for this pair in the weeks ahead, and months.
There is room for growth.
100% bullish above support —blue lines on the chart.
In general, NILUSDT (Nillion) continues bullish as long as it trades weekly and monthly above the All-Time Low. Easy buy and hold.
Decentralizing privacy related data? Sounds great!
Namaste.

NIL ANALYSIS (4H)The NIL correction started from the point we marked as Start on the chart.
This correction appears to be a Diametric, and it seems we are currently in wave E of this pattern. The price is expected to follow the path indicated by the arrow.
A daily candle close above the invalidation level will invalidate this analysis.
invalidation level: 0.521$
For risk management, please don't forget stop loss and capital management
When we reach the first target, save some profit and then change the stop to entry
Comment if you have any questions
Thank You

NILUSDT Forecast: Anticipated Bearish Move AheadBased on the EASY Trading AI strategy analysis, NILUSDT currently demonstrates bearish sentiment. Our entry point is marked at 0.502 with projected targets indicating downward movement toward a Take Profit at 0.47033333. Protective Stop Loss is clearly defined at 0.54033333 to mitigate potential risk.The trading model identified this sell signal due to weakening bullish momentum, price-volume divergence, and emerging resistance around the 0.502 region. These combined factors point towards a short-term bearish phase.Traders, remain disciplined and adhere strictly to provided entry, take-profit, and stop-loss parameters to optimize risk management and trade efficiency.

$NilIs nil going to nil?
Probably last chance to bounce somewhere around here. Bullish if reclaim 0.55$
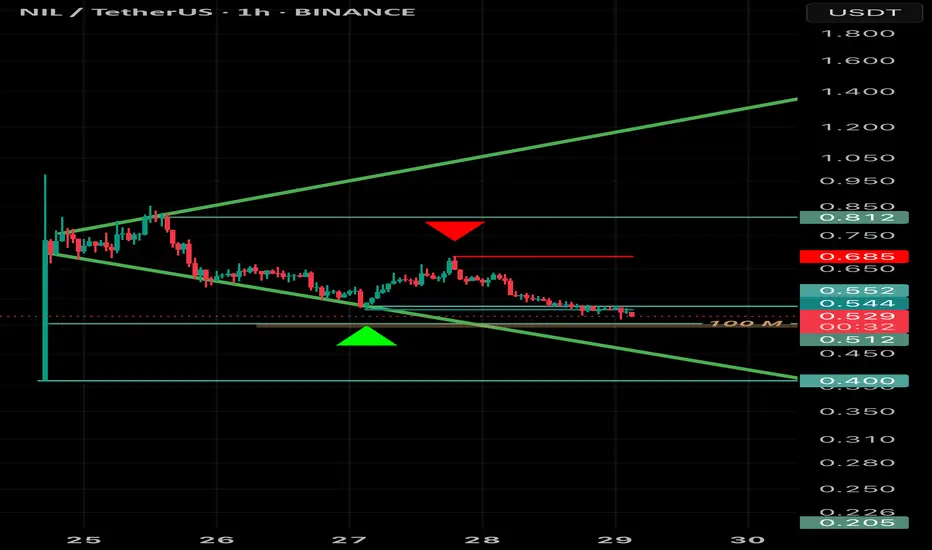
NILUSDT Hourly Technical AnalysisNILUSDT Hourly Technical Analysis
Nillion Coin is experiencing selling pressure below the 21-day moving average in the 1-hour technical analysis. Currently, it is trying to recover after forming support at 0.5441. The decline in Bitcoin has also affected Nillion Coin. Indicators are partially positive and moving in a neutral position. For NILUSDT to recover, it needs to break above the 21-day moving average and surpass resistance levels.
NOT INVESTMENT ADVICE.
The information, comments, and recommendations provided here do not constitute investment advice. Investment advisory services are offered within the framework of an investment advisory agreement signed between investors and brokerage firms, portfolio management companies, or non-deposit banks. The opinions expressed on this page are solely personal views. These views may not be suitable for your financial situation, risk tolerance, or return preferences. Therefore, no investment decisions should be made based on the information and statements provided on this page.
To stay updated on our analyses, whether positive or risky based on technical indicators, we would appreciate it if you follow and like us.

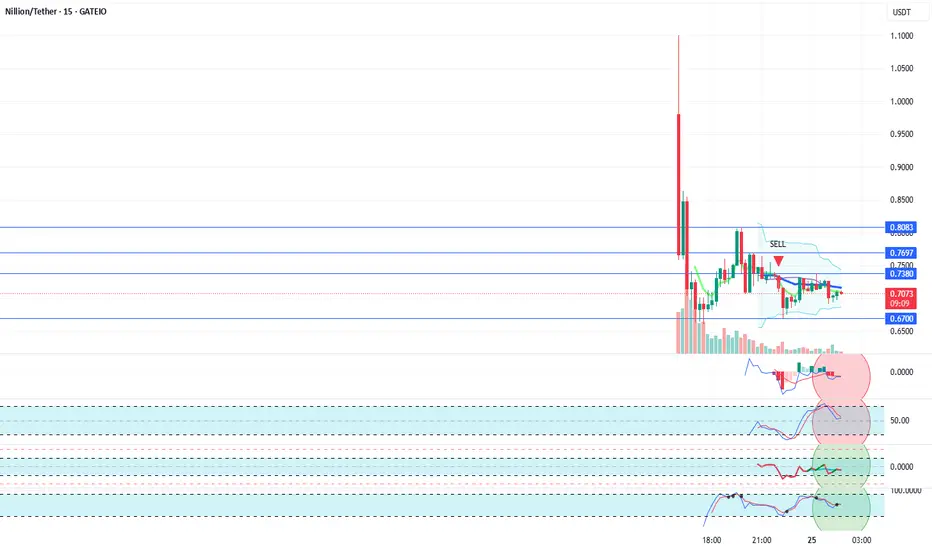
NILUSDT 15 Minute Technical AnalysisNILUSDT 15 Minute Technical Analysis
Nillion Coin's 15 minute chart on Binance is currently showing a sideways movement. It is above the 0.67 support level and moving at the same level as the 21-day moving average line. We believe Nillion Coin has the potential to rise to higher price levels. There is a possibility of retesting the 0.8083 resistance level. Since hourly and daily technical data are not available at the moment, we are sharing the analysis based on 15 minute data.
NOT INVESTMENT ADVICE.
The information, comments, and recommendations provided here do not constitute investment advice. Investment advisory services are offered within the framework of an investment advisory agreement signed between investors and brokerage firms, portfolio management companies, or non-deposit banks. The opinions expressed on this page are solely personal views. These views may not be suitable for your financial situation, risk tolerance, or return preferences. Therefore, no investment decisions should be made based on the information and statements provided on this page.
To stay updated on our analyses, whether positive or risky based on technical indicators, we would appreciate it if you follow and like us.