Nimiq: Trend Reversal (700% Potential Or More — Trading Basics)I am mapping 700% potential for Nimiq (NIMBTC), what do you think? The falling wedge pattern is coming to its end. We have a major ATL as well as long-term lower low. The last three sessions closed green. A reversal can happen soon.
This is a Bitcoin pair and its last major bullish happened in 2020
Related coins

NIM - ready to start1. The first and second waves are finished, the 3rd wave is coming soon
2. Strong divergence on RSX
3. Breaking of the descending channel
4. The coin has a good fundamental and very undervalued

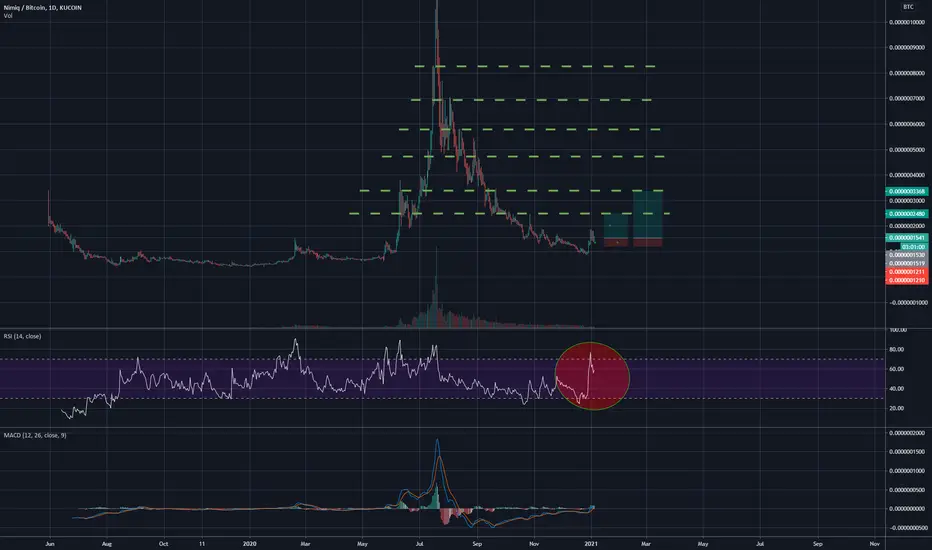
NIMIQ has bottomedNIMIQ needed some time to shake out every weak hand. After the price explosion in May, it corrected very deep and bottomed before the latest break out. The pattern of the last days is very clear and we have seen this pattern in NIMIQ always before it pumped. We could see another very strong really.

Should I buy NIMQ?NIMBTC Forecast @ 1HR Timeframe |
I am planning to buy some NIMQ, however, based on this chart, there are two potential directions: the price has the potential to touch the resistance line at 0.00000016 level but it is likely to go down passing the main support @ 0.0000001331. At this point, I cann

NIMBTC @ 1 HR CHARTBased on the wave theory, there is a high probability that NIMBTC price will close above the resistance level of 0.0000001323 thus forming a new support.

NIMBTC Nimiq, reversal ?So, we are on the verge of new uptrend for NIMBTC pair. This are 2 scenarios that I'm considering right now:
1. Triple MA and MACD cross on weekly chart will state beginning of huge uptrend
2. No cross on Triple MA and MACD, will lead to further trading corridor or continuation of downtrend.
I'm m

Nimiq the next Ravencoin?I have been following this project for some time now and I think Nimiq has a lot of upside potential. Nimiq is a usability focused crypto-currency.

Massive move on momentum, RSI in overbought, bullishMomentum could be building up again to another strong push to test highs in the next few weeks. Bullish. RSI Looking great.
L1000X Indicator Final Version + TutorialThis is the final version of L1000X, it is complete until further notice
Added Histogram, will show you the true length of oscillations and reacts 6 candles faster than MACD in this experiment.
Histogram also shows the intensity of trend by height of candles and the color of histogram columns,
TU

NimBTC Weekly- Diagonal Confluence Trading= Long NIMBTC!Nimiq to BTC bullish OBV setup, in buy setup of buy/sell confluence trend as well as diagonal buy/sell confluence trend on price.
Bitcoin is also very bullish vs USD so this is great for the price of NIMUSD.
There are other reasons such as hype for Nimiq 2.0 release that this coin is a great buy

See all ideas
Summarizing what the indicators are suggesting.
Oscillators
Neutral
SellBuy
Strong sellStrong buy
Strong sellSellNeutralBuyStrong buy
Oscillators
Neutral
SellBuy
Strong sellStrong buy
Strong sellSellNeutralBuyStrong buy
Summary
Neutral
SellBuy
Strong sellStrong buy
Strong sellSellNeutralBuyStrong buy
Summary
Neutral
SellBuy
Strong sellStrong buy
Strong sellSellNeutralBuyStrong buy
Summary
Neutral
SellBuy
Strong sellStrong buy
Strong sellSellNeutralBuyStrong buy
Moving Averages
Neutral
SellBuy
Strong sellStrong buy
Strong sellSellNeutralBuyStrong buy
Moving Averages
Neutral
SellBuy
Strong sellStrong buy
Strong sellSellNeutralBuyStrong buy
Displays a symbol's price movements over previous years to identify recurring trends.