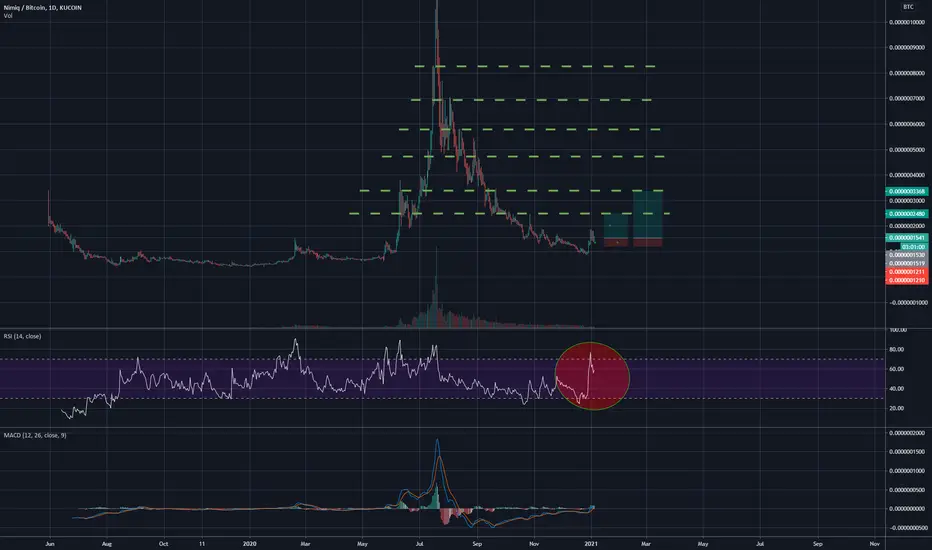
Nimiq: Trend Reversal (700% Potential Or More — Trading Basics)I am mapping 700% potential for Nimiq (NIMBTC), what do you think? The falling wedge pattern is coming to its end. We have a major ATL as well as long-term lower low. The last three sessions closed green. A reversal can happen soon.
This is a Bitcoin pair and its last major bullish happened in 2020. Between December 2019 and June 2020 (196 days). Total growth amounted to 3,650%, which is great.
After a major All-Time Low and more than four years of bearish action, 700% seems easy right? Definitely do-able.
So we aim for 700%, maybe lower but still staying open to seeing even higher, because this is a strong possibility. We cannot limit ourselves nor the market potential in any way, shape or form.
When we trade Altcoins vs Bitcoin, spot, we focus on getting the bottom. This is the most important part. Once we have the bottom, we just wait for the market to turn and enjoy the ride up. After the market turns bullish anything goes.
How to approach the targets?
The classic method we use is to set the sell orders beforehand. After you buy, you do your calculations and start placing the orders, sell-limit, and forget it, you let the market take care of the rest.
As we gain experience, this strategy can be expanded and we can approach the targets in many different ways.
I am wishing you love, health, wealth and success.
Enjoy your day, enjoy your life... You are eternal.
Thank you for reading.
Namaste.
NIMBTC trade ideas

NIM - ready to start1. The first and second waves are finished, the 3rd wave is coming soon
2. Strong divergence on RSX
3. Breaking of the descending channel
4. The coin has a good fundamental and very undervalued

NIMIQ has bottomedNIMIQ needed some time to shake out every weak hand. After the price explosion in May, it corrected very deep and bottomed before the latest break out. The pattern of the last days is very clear and we have seen this pattern in NIMIQ always before it pumped. We could see another very strong really.

Should I buy NIMQ?NIMBTC Forecast @ 1HR Timeframe |
I am planning to buy some NIMQ, however, based on this chart, there are two potential directions: the price has the potential to touch the resistance line at 0.00000016 level but it is likely to go down passing the main support @ 0.0000001331. At this point, I cannot take the risk to buy some NIMQ and need to see if it touches the support level.

NIMBTC @ 1 HR CHARTBased on the wave theory, there is a high probability that NIMBTC price will close above the resistance level of 0.0000001323 thus forming a new support.

NIMBTC Nimiq, reversal ?So, we are on the verge of new uptrend for NIMBTC pair. This are 2 scenarios that I'm considering right now:
1. Triple MA and MACD cross on weekly chart will state beginning of huge uptrend
2. No cross on Triple MA and MACD, will lead to further trading corridor or continuation of downtrend.
I'm more bullish right now, as Bitcoin is in correction phase for next 2-3 weeks and we may see altcoins to gain some value.

Nimiq the next Ravencoin?I have been following this project for some time now and I think Nimiq has a lot of upside potential. Nimiq is a usability focused crypto-currency.

Massive move on momentum, RSI in overbought, bullishMomentum could be building up again to another strong push to test highs in the next few weeks. Bullish. RSI Looking great.
L1000X Indicator Final Version + TutorialThis is the final version of L1000X, it is complete until further notice
Added Histogram, will show you the true length of oscillations and reacts 6 candles faster than MACD in this experiment.
Histogram also shows the intensity of trend by height of candles and the color of histogram columns,
TUTORIAL:
How to Read Histogram(Red and green column chart on L1000X indicator.):
-Dark Green-
Strong Bullish
-Light Green-
Light Bullish
-Dark Red-
Strong Bearish
-Light Red-
Light Bearish
How to Read L1000X Fast and Slow Signal Lines with Histogram for trading and investing ideas.
-Blue is Fast and Orange is Slow *Used color palette of MACD to be usable on any chart layout*
Cross down= Fast crosses Slow from above. Can indicate a reversal in trend, can also indicate trend continuation(bounce).
Cross up= Fast crosses Slow from below. Can indicate a reversal in trend, can also indicate trend continuation (bounce).
Buy Setup= Fast drops well below Slow
Sell Setup= Fast grows well above Slow
Swing over= The description of the full shape of a buy setup, wave crossing up, and a sell setup.
Swing under= The description of the full shape of a sell setup, wave crossing down, and a buy setup.
Crest= In a Swing over or swing under, a high momentum candle is proceeded by lower momentum of the same trend, can indicate reversals.
Scalp= A small swing over or swing under which is proceeding a bounce in the prevailing trend
Bounce= A swing over or swing under, in a situation where may look like a sell or a buy, but continues in direction of the trend. Fast may bounce off of the slow, or even away from it.
Prevailing Trend- Trend which has been indicated in majority of by the Histogram for the timeframe you are looking at
Confluence= when Histogram, Prevailing Trend and Fast over/under Slow all indicating of a reversal, to try to predict tops and bottoms
Thanks for your support! L1000X Labs

NimBTC Weekly- Diagonal Confluence Trading= Long NIMBTC!Nimiq to BTC bullish OBV setup, in buy setup of buy/sell confluence trend as well as diagonal buy/sell confluence trend on price.
Bitcoin is also very bullish vs USD so this is great for the price of NIMUSD.
There are other reasons such as hype for Nimiq 2.0 release that this coin is a great buy right here!

Nimiq vs BTC, Diagonal Confluence (Reup)Apparently pictures and charts don't speak 1000 words, last time I uploaded this chart it was set as "Not Suggested"
Buy the dip of NIMBTC below the bottom of Buy/Sell diagonal confluence trend.
Sell the NIM above the top line of diagonal confluences, or don't, your choices today affect your future.
Never Heard of Nimiq? They're an up and coming competitor to BTC and XRP with a revolutionary business model. DYOR.
Cheers from the future.


Potential support from previous trend line Downtrend resistance is meeting the previous support from June. A triangle is forming which can break either way, my bet being an upwards trend shift.


Nimiq finally finds support and ready to bounce backNimiq after neverending droping finally finds support. I believe in bounce back and if there would be more buy volume when it reach upper trendline, we potentially break huge falling wedge

Nimiq Trend Reversal!After Nimiq's great run a couple months back it has been cooling off and steady down ward path. It now has started a slow and steady up trend. The RSI
is also confirms the action. The one thing we need to see now is a substantial amount of volume to show people bought it.


Nimiq - long term resistances to breakThe previous pitchfork has broken down and the support has become the major resistance.
Short-term we are in the decending pitchfork with 54.9 sats being the top resistance line, going lower.
Generally follow the pitchfork and once we break upwards from the PF, seek the previous support (now resistance, bold line) to be next target to break.
Short-term, I'm bearish and looking to sell above the middle of pitchfork and rebuy below the middle of pitchfork.


Nimiq on very strong support!Nimiq has caught very strong support on the 100 day moving average and it coincides with previous resistance & support and major buy area. Nimiq could be caught range bound here for a little a while but make no mistake this is an accumulation zone until it makes it's next move. There is very good opportunity for a very nice swing trade here. Easy 2 to 3x trade possibly more, so fill your bags.
It's simple guys... the chart clearly shows the meaning of this quote.
"Be greedy when everyone is fearful and fearful when everyone is greedy"--- Warren Buffet

Next triangle to breakI'd give a 50/50 chance of breaking in both directions, we'll see how it goes quite soon. Pay attention to SR lines.


