EUR/NOK 1H Chart: Downside potentialThe Norwegian Krone has been appreciating against the Euro in a short-term descending channel. This movement began on September 7 when the pair reversed from the upper boundary of a long-term descending channel.
As apparent on the chart, the currency pair is pressured by the 55– and 100-hour SMAs. Most likely that the pair will continue to go down and will aim for the support level formed by a combination of the weekly S1 and the Fibonacci 100.00% retracement located circa 9.4100.
If given support level does not hold, it is likely that the exchange rate will continue to go downside to the weekly S2 at 3.3377.
NOKEUR trade ideas


EURNOK to rally=> Here we are arguing from the angle that the bearish sentiment on EURO as mentioned in our previous ideas will fade and begin to position into a solid macro narrative.
=> Qatar has announced an FX swap agreement with Turkey for $15bn this morning, frankly they might as well wave goodbye to this money with Erdogan at the helm. Short-term however this will provide support for EMU based banks.
=> ECB's Weidmann has begun talking up policy normalisation as expected and on the other side of the coin we have Italy praying for an extension in QE.
pascalToday at 10:00
=> Concerns over continued pressure on commodity prices is not painting a pretty picture for NOK. Markets have fully priced in the hike coming in September from Norges Bank and we are starting to see smart money taking profits.
=> We are targeting 9.80 - 9.90 with stops below the recent 9.50 low
=> Good luck


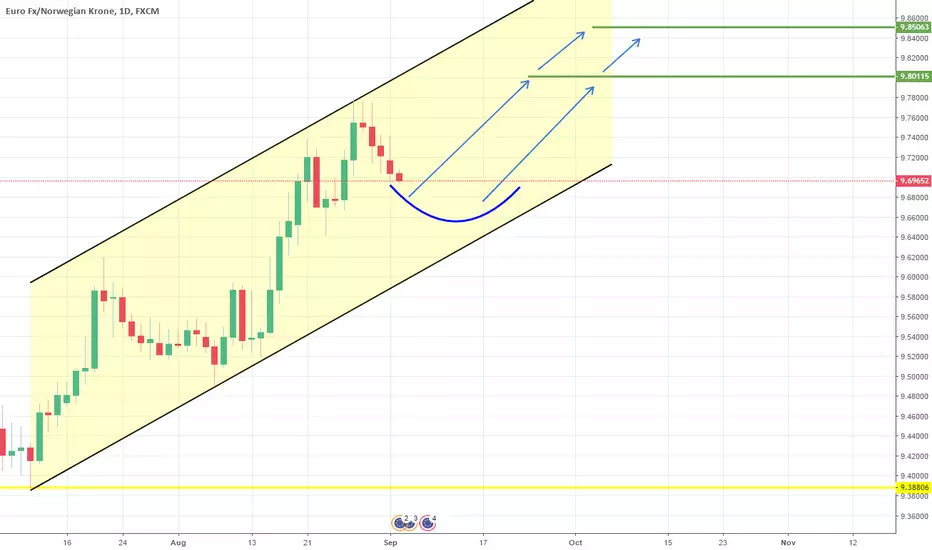
Pull back on 1D Channel Up. Long on Higher Low.EURNOK is trading on a 1D Channel Up (RSI = 57.905, MACD = 0.040, B/BP = 0.0035) that is pulling back to issue a new Higher Low. Given the neutral Highs/Lows = 0, this is close, so we will be going long with TP1 = 9.800 and TP2 = 9.8500 in extension.
EURNOK Short PlayPotential reversal on this exotic pair!
Top of the zone, around the -61.8 fib extention
looking to short to TP1: 0 fib level
TP2 61.8 Fib Level


EUR/NOK 1H Chart: Pair shows signs of reversalThe most recent development of the EUR/NOK exchange rate is a breakout from the senior channel which occurred near 9.59 on August 16. This move has extended the pair’s three-day gain to 1.65%.
As a result, the Euro reached the upper boundary of a ten-week ascending channel at 9.68. Even though the price still continues to edge higher today, technical indicators are starting to point to a possible change in sentiment.
It is likely that a reversal south occurs soon, as the current three-day surge cannot be sustainable for long. It is likely that the pair makes a U-turn near the channel line and the 23.60% Fibonacci retracement somewhere in the 9.70 area. A possible downside target for the following sessions is the 55– and 100-period (4H) SMAs and the monthly PP at 9.50.


Possible Right Triangle BreakoutCurrently the price is oscillating between a descending resistance and bottom support that consists of the EMA 50 and Historical Support/Resistance. Pending the downward breakout there could be a bounce off the EMA200 and a retest of the EMA50/Historical Level before a drop to the blue historical level. There is a slight possibility of an upward breakout, but it does not seem likely.

BUY SET UP IN EURNOK - DAILY CHARTHey Traders,
Sharing this one to you. Very easy, look for buy set ups all the way to the area marked with the Blue square.
Carlos

1W Channel Down. Long-term short.EURNOK has just posted a Lower High on the long term 1W Channel Down (RSI = 48.488, MACD = -0.015, ROC = -1.366). 9.500 is an important 1D support level and will be tested shortly to confirm the new bearish leg on 1D (now on neutral RSI, Highs/Lows). We are taking this opportunity to open a medium term short with TP = 9.38806.

A curious long idea on this exotic EURDKK pair :)I never really traded this exotic EURDKK pair before but this setup on the daily chart looks interesting for the long side. Let's see if we can hit our both TP targets. Let's GO!! :)

EurNok showing weakness after a strong move up.FX:EURNOK
Entry Price: 9.513
Stop loss: 9.543
Take Profit: 9.405

EUR/NOK is getting ready for the next impulse on weekly chart!!!This is a long term trade (around 1-2 months)
I see some bullish signals on weekly chart and looking for a breakout from inclined resistance.
Buy-in zone:
9.22-9.50
Profit Targets:
9.738
10.2
Stop-loss:
9.12
Have a nice week,
Berk.

My long term view on EURNOKAlright, many of you are probably not trading norwegian krones but maybe this could be an idea on other trading pairs?
I'm currently short on EURNOK, but I think it will turn up in beginning of October:
Entry on a long position: 9.24NOK
When: 3. October 2018
Arguments:
- It is currently in a rising wedge and 4. wave is the next stop.
- This is confirmed by 0.618 fib level, Gann line (two of them are crossing in the same point!) and Gann arc.
- We see that the volume is rising within the rising wedge - a good sign on a further ascending period.
Forecast:
- Next stop will be 10.15NOK
- When: 25. June 2019
- Since this is a rising wedge it might drop after 25. June.


EUR-NOKAn interesting graphic situation on EUR-NOK 4-hour chart. It's likely a pullback on the blue trendline before an increase in the price up to the profit area at 9.5600/9.5700. Stop loss at 8.4390/8.4400.

