EURNOK, 4H, AB=CDA really nice 1:1 AB=CD pattern was just completed on EURNOK 4h.
The only "warning" is the "fast" fall down to the D-point = Tight SL.
RSI is oversold as well but the more restrictive can wait for it to break up over 20 (or 30 for those who use that).
The risk is that you miss a large part of the movement. As always - your plan and what you have tested is what determines how you should
take a trade.
For that reason, that is according to My plan in these conditions, I only place 1 position in this case - ie. half the risk of a "normal" trade with 2 positions.
NOKEUR trade ideas


EURNOK intact down trendIntact Downntrend. Short on longterm. Long for trading the movement on shortterm.

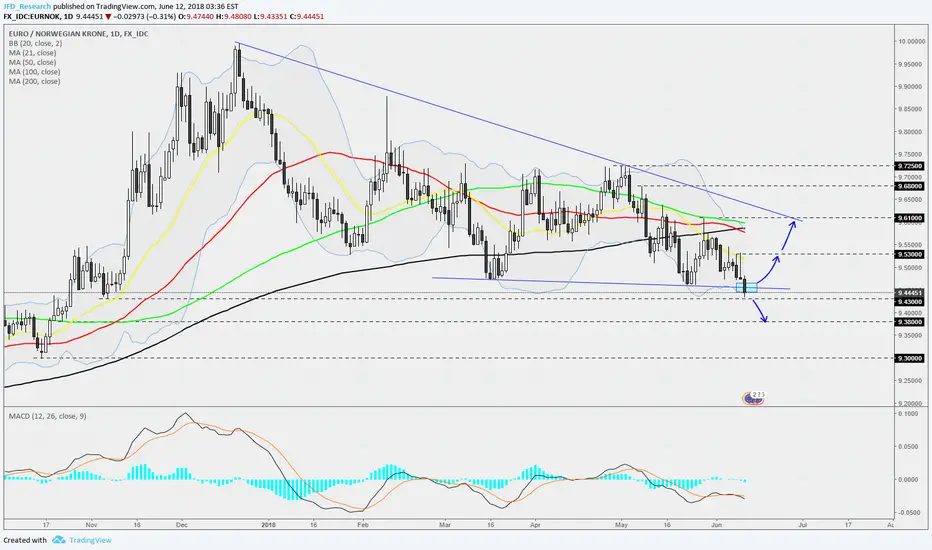
EURNOK - Daily - Watch the closeTrade Alert
Keep monitoring the pair and especially today's close. If EURNOK stays below the bottom side of the wedge, then we could expect some further declines. A strong break of the 9.43 level could lead the pair towards the 9.38 area.
If the EURNOK remains inside of the wedge at the end of the day, then watch out for a possible retracement back to the upside. 9.53 level could be a good area to watch.
Don't forget your SL.

OPEN EURNOK daily tradeThe buy zone is between the the green and red lines. It's recommended to limit buy close to the green line, in order to guarantee the position. The red line is about 250 pips below the green line, and acts as the stop-loss level. There is no target price yet. This trade will be monitored once every evening. If there is no update, it means the trade is still active. Once the trade is closed successfully, a risk-to-reward ratio will be determined. This strategy only requires reviewing the price action trend once every day.

38.2% Retracement LONG GWAVE38.2% Retracement LONG GWAVE.
FIB Retracement Percentage is calculated in a Higher Euclidean Dimension.
PLEASE ALWAYS WAIT FOR STOCHASTIC CONFIRMATION!!! THANKS


EURNOK longThe larger picture is obviously a more massive bearish movement, but over the next 2 to 3 weeks... a long setup is ok. Riding the retracement upwards in the interim as it is a significant move, and then inverting and getting into the short position once target reached.

EURNOK 4HR SHORT OPPORTUNITYTrade what we see:
Price is following a bearish channel with lower highs forming.
We have two support lines to work off, one formed on the 4hr chart and the second formed on the daily time frame.
A pin bar is forming now and I am waiting to setup this short position which has a great risk / reward ratio.
If this pair breaks out and we see a successful retest, then there will be a good long bias.

Weekly EURNOK - Potential Carry Trade IdeaEURNOK is setting up a low volatility breakout on the weekly chart.
This may be longer-term carry trading idea, but be sure to check
your rollover and spreads because it's an expensive pair to trade
and the volatility alone makes it troublesome.

38.2% Retracement LONG GWAVEGWAVE LONG, 38.2% Retracement .
FIB Retracement Percentage is calculated in Higher Dimension.
PLEASE WAIT FOR STOCHASTIC CONFIRMATION!!! THANKS

EUR/NOK 1H Chart: Long-term triangle dominatesThe EUR/NOK exchange rate has been constrained by a descending triangle which was formed in November, 2017. After testing the upper boundary of this long-term pattern early in May, the common European currency began depreciating against its Norwegian counterpart, thus reaching its bottom boundary at 9.47, likewise reinforced by the monthly S2, mid-yesterday.
It is likely that some downward pressure still prevails during the remaining part of this week, given that the pair might be pressured lower by the combined resistance of the 55-, 100– and 200-day SMAs near 9.60. However, the general price direction should nevertheless remain upwards in line with the prevailing triangle pattern, with its upper boundary being located at 9.65.


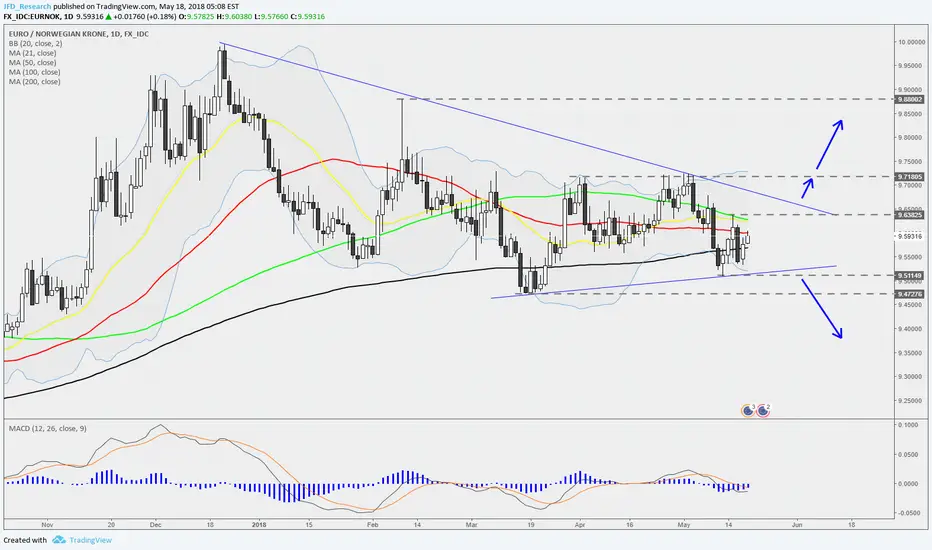
EURNOK - Daily - Wait for itTrade Alert
Wait for the break outside of the formation. It might take a while, so we could expect a stronger move on the way out.
This something for you to keep monitoring.
Don't forget your stops!
EurNOK will touch 9.75Hello everybody
I Think EurNok will touch 9.8
this analysis have good R/R
Follow me at Telegram @forexadvisers

EURNOK longClearly, it is forming a bullish ascending triangle, now we have retraced to the resistance line which means it will target the flat top.
this may be the last move inside the tringle before a breakout to our second target
EUR / NOK
BUY:9,634
TARGET 1 : 9,715
TARGET 2 : 9,924

EURNOK Buy IdeaEURNOK Buy Idea @Dialy Demand Zone (9.61862 - 9.58448)
Buy Limit: 9.61862
Stop Loss: 9.58209
Take Profit: 9.66174

EuroNOKkeep your eyes with the triangle; and if the price broke the triangle wait for correction to follow the trend


BUY EURNOKContinuation pattern for uptrend, Head and Shoulders formation, 50Days Ema signaling uptrend, good opportunity to buy.

