NOKJPY – Detailed Macro Analysis & Trade IdeaMacro Bias: LONG NOK / SHORT JPY
Why NOKJPY?
1. Fundamental Macro (ENDO):
Norway (NOK):
Strong inflationary pressure, positive PMI, robust M2 growth.
Massive fiscal surplus driven by energy exports – best debt/GDP ratio in the G10.
Norges Bank still maintaining relatively high interest rates.
Positive Terms of Trade, central bank balance sheet (CBBS) is shrinking (long-term bullish for NOK).
Japan (JPY):
Economic stagnation and deflationary risks, weak PMI and consumer spending.
Negative real yields, central bank remains ultra-accommodative, extreme debt/GDP ratio.
Persistent deflationary sentiment – classic “funding currency” for global carry trades.
2. COT Positioning (Commitments of Traders):
JPY is the most crowded short in the entire G10: hedge funds and leveraged funds are aggressively short JPY.
NOK positioning is neutral to slightly long – no overcrowding risk on the long side.
3. EXO & Sentiment Signals:
Terms-of-trade and projected GDP/CPI all favor NOK.
Sentiment, macro “score,” and risk/reward models consistently generate a long NOKJPY signal.
Exogenous indicators (futures, commodity impulse, sentiment, parity) all support NOK strength.
4. Technicals & Carry Edge:
NOKJPY remains in a strong multi-month uptrend.
Major carry advantage: NOK rates are much higher than JPY, yielding significant positive swap.
Every recent pullback has been bought, and momentum remains bullish.
Key Reasons for the Trade:
Multi-model consensus: No contradiction between macro, COT, exo, and technicals.
NOK is “king of G10” by every fundamental measure; JPY is the weakest currency this cycle.
Textbook carry trade for 2025.
Risks:
Only a sudden global “risk-off” or a central bank policy shock could temporarily disrupt the trend.
Currently, there is no crowding risk on NOK longs.
SUMMARY:
LONG NOKJPY is the cleanest, highest-conviction swing trade for this cycle – every model (macro, COT, exo, sentiment, carry) is in agreement.
Every meaningful pullback is a buying opportunity.
NOKJPY trade ideas


NOKJPY - Buy Setup from Key SupportFOREXCOM:NOKJPY is currently at a significant demand zone that has historically attracted buyers, triggering bullish reversals. This support level has been pivotal in past price actions, forming a solid base for potential upward momentum.
The appearance of a strong bullish candle reinforces the setup, suggesting the likelihood of an upward movement, with a target around 13.7785. However, if the support level is breached, the bullish sentiment could fade, allowing for a possible decline.
Traders should remain alert in this zone for signs of buyer strength before taking long positions. Proper risk management is critical to mitigate the risk of losses.


NOK JPY : Huge Off Lows & Thumping LONG right now
NOK JPY bounced off its lows very recently & broke out from its oversold condition.
It then made a Fib retracement & demand just got bigger for the long trade on this.
Standby below and I will work out a Stop Loss. Longer term trade here.

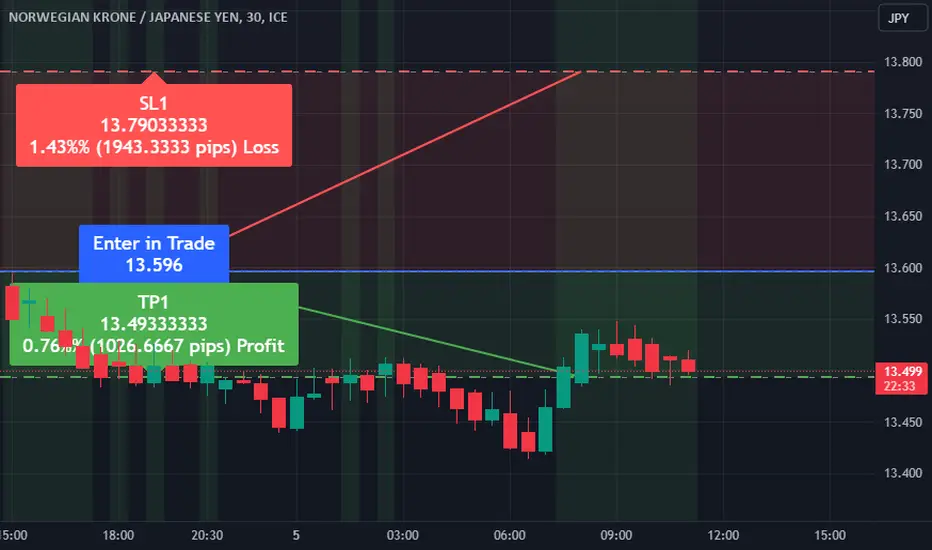
Trade Alert: NOKJPY Pair Analysis and SignalDirection: Sell
Enter Price: 13.596
Take Profit: 13.49333333
Stop Loss: 13.79033333
We are issuing a trade signal to sell the NOKJPY pair at an entry price of 13.596. The take profit level has been set at 13.49333333 and a stop loss has been placed at 13.79033333. This analysis has been conducted using the EASY Quantum Ai strategy.
Reasoning for the Signal:
1. Technical Indicators : Our technical analysis shows a bearish trend supported by multiple indicators including Relative Strength Index (RSI) and Moving Average Convergence Divergence (MACD), both suggesting downward momentum.
2. Support and Resistance Levels : The pair has recently tested significant resistance levels, failing to break through, indicating a potential downtrend.
3. Market Sentiment : Current fundamental analysis indicates that economic data from Norway and Japan favors a weaker NOK against JPY.
This signal is based on comprehensive data analysis using the EASY Quantum Ai strategy which factors in both technical and fundamental indicators to provide an informed trading decision. Please ensure you manage your risks appropriately and adjust your portfolio based on your risk tolerance.
Happy Trading!

Keep shorting Looks like we're in for swipe 2 to the downside. Keep shorting. MACD hist. is also pointing downwards, so we have a bearish convergence here.

NOKJPYIn the 4-hour timeframe, a bullish signal emerged as the 13 Exponential Moving Average (EMA) crossed above the 5 EMA, indicating potential upward momentum in the currency pair. However, caution is advised due to the Trade Development Index's Fast Moving Average (Fast MA) surpassing 20, suggesting overbought conditions. Furthermore, Fibonacci Retracement analysis aligns with a bearish outlook, confirming a potential downside target. Utilizing pivot points for guidance, a calculated Take Profit level can be established to capture potential gains. Traders should consider these technical indicators collectively to make informed decisions and manage risk effectively.


NOKJPY ShortNOKJPY cannot make a new higher high and it hits resistance level, so we can look for short order.
Good luck.
Stopping loss is necessary. Always keep it with your all trades.

NOKJPY | Daily Outlook | Trade IdeaLooking at the Norwegian Crone/Japanese Yen (NOKJPY) daily chart we can see that it has been ranging for a while after bouncing of our key price level at 12.250 a few months back and has been consolidating since then after failing to break above 12.880.
Now looking to the right we can see that NOKJPY just broke out of our current consolidation and if it manages to close below 12.600 I’ll be looking to hold my sells all the way down to 11.620 with my stops at 12.800.

NOKJPY Watch price action for sell Hi there,
NOKJPY is setting up for short.
Watch MAs and look for short.
Good Luck

High Risk NOKJPY $NOKJPY Initial LongHigh Risk NOKJPY $NOKJPY Initial Long. I will not be taking this trade. TP and SL on chart. Move SL on TP. After TP2, trail with 0.5ATR step and 1.5ATR offset.


NOKJPY $NOKJPY Initial ShortNOKJPY $NOKJPY Initial Short. TP and SL on chart. Move SL on TP. After TP2, trail with 0.5ATR step and 1.5ATR offset.

UP UP UPOverall Average Signal from all our indicators suggests a Long. Entry is at market open and exit is shortly before market close or whenever you are okay with profits.


nokjpy shortnokjpy short shorrrrrrrrrrrrrrrrrrrrrrrrrrrrrrrrrrrrrrrrrrrrrrrrrrrrrrrrrrrrrrrrrrrrrrrrrrrrrrrrrt


NOKJPY Week ShortOverall Average Signal from all our indicators suggests a Short. Entry is at market open and exit is shortly before market close or whenever you are okay with profits.

NOKJPY Watch price action for short Hi there,
NOKJPY is setting up for a bearish wave.
Watch the price action and look for short.
Good Luck
