NOKUSD trade ideas

USD/NOK short/sell idea. almost 6700 pips move...In the name of ALLAH who is most merciful and the master...
We take trading as a business, not a gambling stuff.
We have calculated approximate risk to reward ratio.
Please note:
-> Never go beyond 1.5% risk of your total trading capital on a single trade,
-> Always move your stops to your entry levels after the price moves 100 pips towards target,
-> Close half of the trade position after market makes half movement towards target.

buyim looking to buy this breakout with a stop below the lows and no take profit as i want to ride an uptrend


USD/NOK Longstop-loss just underneath EMA 50 and target 9,6. If it falls to stop-loss reverse position and place stop-loss at 9,35 with target EMA 200.


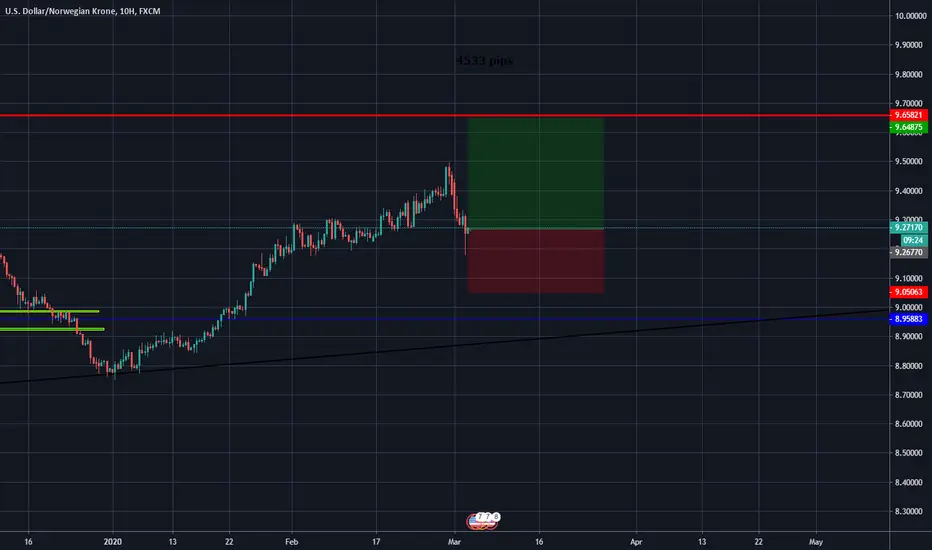
USD/NOK short/sell idea. almost 4000 pips move...in the name of ALLAH who is most merciful and the master...

USDNOK idea short USDNOK idea short
The price reached the top line of the channel and turned around , I expect a drop


USDNOK - Rejection ResistanceWe rejected from the upper trendline of the rising channel given on the chart. If we fail to break resistance, price might fall back to the lower trendline of the channel.

usdnok 26th febi got this ascending triangle close to a trend line on the daily chart... im expecting a drop... let me know what u think please :p

USDNOK analysisNOKUSD and AUDUSD are negatively correlated to one another. NOKUSD broke a recent 1 hour support and support becomes resistance. A retest of the resistance zone showing signs of bearish pressure will activate a sell. Stop loss about the previous 4 hour candle. Take profits at 9.19556 and 8.99136.


Potential Bearish Movement on USDNOKPrice has been made a 5-impulsive-wave towards the daily resistance zone with ending diagonal pattern. Also, it has been shown a reversal as well as a strong divergence. By breaking the rising wedge downward, it will confirm that it has been started a corrective structure for the impulsive wave. Shorting the pair to the previous support zone will be a good idea in case of confirmation.


Pending shortFIB 161.80 extension then we will short it. Until it reaches the high, we need to be patient and go for a great short.


