Should we buy Natcoin now or wait?Hello friends
According to the complete analysis we have done for you, we have concluded that the price has reached an important support with a deep correction that buyers were able to support the price to some extent, and if the support is broken, there is another important support that we have determined that the price can be expected to grow from there.
Our suggestion is to buy steps at important supports, of course with capital and risk management...
Targets have also been specified.
*Trade safely with us*
NOTUSDT trade ideas

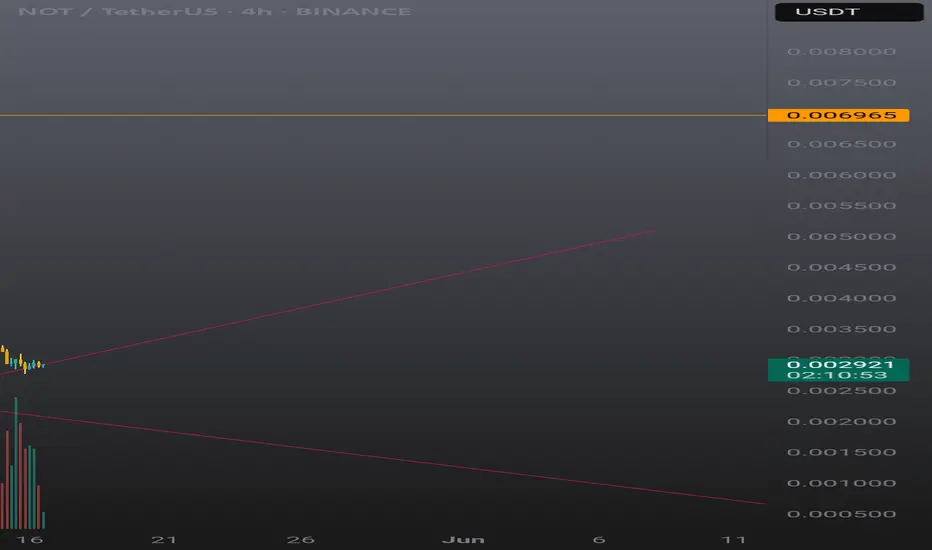
NOT $NOT Short Trade
**Entry Price:** 0.00695
**Target Prices:** 0.00659 - 0.00487
**Stop Loss:** 0.007325

NOTUSDT 1D AnalysisNOT ~ 1D Analysis
#NOT Buy gradually from here if you still have confidence in this coin with a short term target of at least 15%+.

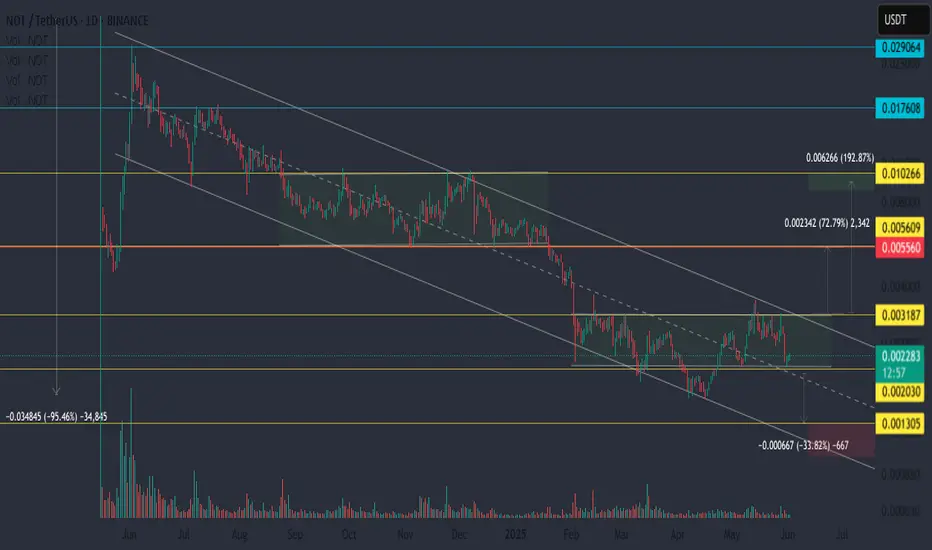
NOTUSDT – End of the Downtrend or Just Another Trap?🔻 Macro Trend:
Since its launch, NOT has been moving steadily inside a descending channel, losing around 95% from the top.
Currently, we’re seeing the second major consolidation zone forming — just like the first one earlier in the trend.
🔄 What’s Next?
We're at a crossroad:
Either a third accumulation range is building inside the downtrend,
Or this consolidation is setting the stage for a trend reversal.
You can bet on either scenario — just make sure your risk management accounts for both.
⚠️ Important Reminder:
Assets like this don’t have a classic "bottom."
⚔️ It's a high-risk zone, but the reward potential is also significant.
🙂 Personally, I lean towards the bullish scenario.
But let the market show its hand — we don’t trade hope, we trade price action.
NOTUSDTmy entry on this trade idea is taken from a point of interest above an inducement (X).. I extended my stoploss area to cover for the whole swing as price can target the liquidity there before going as I anticipate.. just a trade idea, not financial advise
Entry; $0.003482
Take Profit; $0.002423
Stop Loss; $0.003820

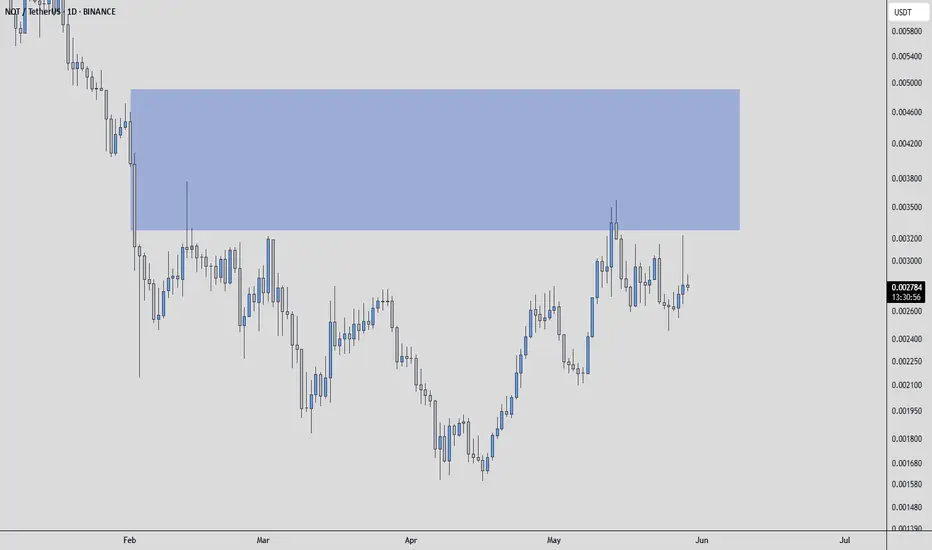
NOTUSDT - SELLERS ARE IN CONTROL!!!Observing NOTUSDT, one identifies a notable blue box on the chart. This area, in the estimation of a discerning investor, appears to function as a significant resistance level.
The principle here is straightforward: when an asset's price ascends to a particular zone and consistently encounters selling interest, preventing further ascent, that zone establishes itself as a resistance. This blue box suggests a concentration of supply, where those who hold the asset are prepared to divest.
At present, my observation indicates that buyers are not actively engaged in overcoming this resistance. The market's current disposition, unfortunately, does not present a bullish outlook for this particular asset.
While technical patterns are not the sole determinant of value, they can illuminate where market participants are distributing positions. A sustained defense of this blue box by sellers, particularly if accompanied by a decrease in buying pressure or an uptick in selling volume, would reinforce its significance. Here, one would also scrutinize the volume footprint for signs of genuine distribution, look for CDV (Cumulative Delta Volume) divergences that might signal a shift in momentum, and patiently await low timeframe (LTF) confirmations to validate any potential short entry.
It is worth noting that my focus is exclusively on assets demonstrating a sudden and significant increase in volume, as such movements often precede more substantial price action. This selective approach helps in concentrating capital where the market is showing clear intent. In this instance, the lack of such decisive buying volume further solidifies my current stance.
Conversely, a decisive breach of such a resistance level would necessitate a re-evaluation, as it would indicate a shift in the balance between supply and demand. However, for the present, this blue box stands as a point of interest for those seeking to understand the potential ceiling for NOTUSDT's price action.
📌I keep my charts clean and simple because I believe clarity leads to better decisions.
📌My approach is built on years of experience and a solid track record. I don’t claim to know it all but I’m confident in my ability to spot high-probability setups.
📌If you would like to learn how to use the heatmap, cumulative volume delta and volume footprint techniques that I use below to determine very accurate demand regions, you can send me a private message. I help anyone who wants it completely free of charge.
🔑I have a long list of my proven technique below:
🎯 ZENUSDT.P: Patience & Profitability | %230 Reaction from the Sniper Entry
🐶 DOGEUSDT.P: Next Move
🎨 RENDERUSDT.P: Opportunity of the Month
💎 ETHUSDT.P: Where to Retrace
🟢 BNBUSDT.P: Potential Surge
📊 BTC Dominance: Reaction Zone
🌊 WAVESUSDT.P: Demand Zone Potential
🟣 UNIUSDT.P: Long-Term Trade
🔵 XRPUSDT.P: Entry Zones
🔗 LINKUSDT.P: Follow The River
📈 BTCUSDT.P: Two Key Demand Zones
🟩 POLUSDT: Bullish Momentum
🌟 PENDLEUSDT.P: Where Opportunity Meets Precision
🔥 BTCUSDT.P: Liquidation of Highly Leveraged Longs
🌊 SOLUSDT.P: SOL's Dip - Your Opportunity
🐸 1000PEPEUSDT.P: Prime Bounce Zone Unlocked
🚀 ETHUSDT.P: Set to Explode - Don't Miss This Game Changer
🤖 IQUSDT: Smart Plan
⚡️ PONDUSDT: A Trade Not Taken Is Better Than a Losing One
💼 STMXUSDT: 2 Buying Areas
🐢 TURBOUSDT: Buy Zones and Buyer Presence
🌍 ICPUSDT.P: Massive Upside Potential | Check the Trade Update For Seeing Results
🟠 IDEXUSDT: Spot Buy Area | %26 Profit if You Trade with MSB
📌 USUALUSDT: Buyers Are Active + %70 Profit in Total
🌟 FORTHUSDT: Sniper Entry +%26 Reaction
🐳 QKCUSDT: Sniper Entry +%57 Reaction
📊 BTC.D: Retest of Key Area Highly Likely
📊 XNOUSDT %80 Reaction with a Simple Blue Box!
📊 BELUSDT Amazing %120 Reaction!
📊 Simple Red Box, Extraordinary Results
📊 TIAUSDT | Still No Buyers—Maintaining a Bearish Outlook
📊 OGNUSDT | One of Today’s Highest Volume Gainers – +32.44%
I stopped adding to the list because it's kinda tiring to add 5-10 charts in every move but you can check my profile and see that it goes on..
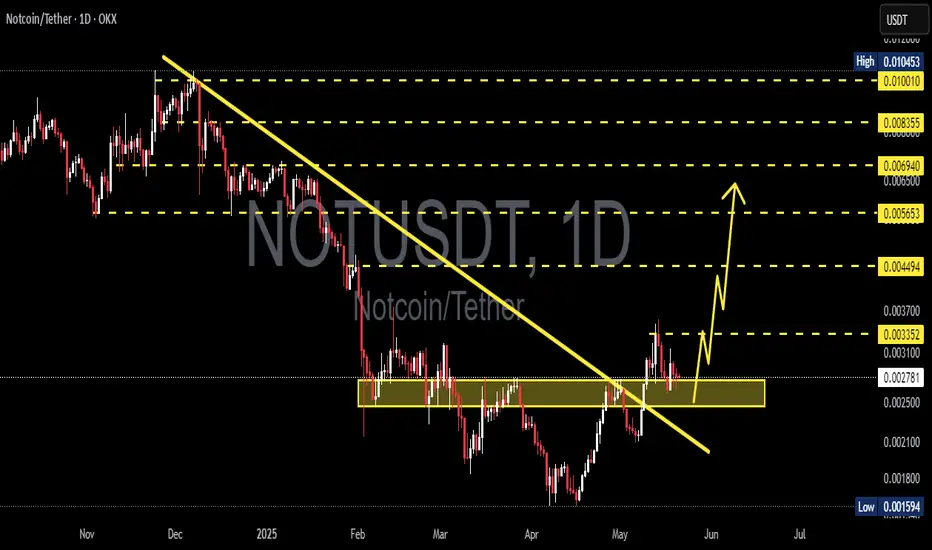
NOTCOIN Bullish Wedge Pattern with $0.1 TargetNOTCOIN is currently consolidating within an extended flag-like structure or falling wedge pattern. The immediate accumulation zone marked on the chart represents a crucial area for potential buying opportunities. A significant bullish momentum is anticipated, which could lead to substantial buying pressure.
On the downside, a key demand area has been identified. This zone is considered optimal for accumulation if the price retraces to that level. We should be prepared to capitalize on any price dips to this area, as it presents a favorable risk-reward ratio.
The ultimate price target is projected at $0.1, suggesting considerable upside potential from current levels. This target aligns with the bullish outlook and the expected breakout from the current consolidation pattern.
As always, proper risk management is crucial when implementing trading decisions.

Notcoin 2,611% Profits Potential (PP) Target RevealedIt is time to consider the bigger picture. Are you ready to look at Notcoin's true growth potential in 2025? I know I am... Follow me and let's get started.
The bottom is in, is there any doubt?
If yes, let's invest a few minutes of our time clearing that doubt.
Notcoin's drop started in May 2024.
Trading volume was weak during the entire bearish period.
A major low happens on the 3-Feb. session and this session ends as a hammer. The action then goes below for a few months and now trades back above it.
The move below and recovery produces a bottom pattern, in this case the inverted head and shoulders. The fact that NOTUSDT is safely trading above the 3-Feb. and 24-Feb sessions low becomes a very strong bullish signal. This level/zone has been tested multiple times as support and holds.
The breakdown 3-March is the result of the final market flush. This type of market move happens before a bull market. The recovery 5-May signals the end of this phase.
The downtrend has been broken, we have the reversal pattern and the action is happening above the strongest support zone on this chart. All this is bullish and points to additional growth.
This growth will be massive, huge and it will unravel long-term, for some 5-8 months. The action is valid now, it started more than a month ago, and it will continue through November 2025 or even longer, through February/March 2026. All that we know for certain, 100% certain, is that Notcoin and the rest of the Altcoins market will grow really strong.
We have great targets on this chart. Even with the strong recovery that already took place, there is room for growth reaching 2,611%. This is a very strong target and new All-Time High, but prices can go even higher.
A more conservative target and strong resistance sits at $0.046583 for a nice 1,598%. This is 17X.
Whatever you do is up to you. With patience, your winnings can be huge.
If you knew ahead of time that the market will grow by 10-20X, what would you do now? How would you take action?
A 1 BTC trade can turn into 10-20 BTC.
Imagine with 2-3X or even 5X.
Make sure to do your own planning because trading always involves risk, but if you approach the market in the right way, you can change your life forever; financial freedom.
Namaste.

#NOTUSDT ( red line )For ideal growth, it should be able to break the main red resistance line.
Hoping to break this line

Notcoin pump to $0.003578Just now entered a long position on notcoin
Targeting $0.003578
Scaling out along the way
See tp on chart
Time sensitive
Stop: $0.02976 (conservative) can be tighter- around $0.003

NOTUSDT 1D Analysis NOT ~ 1D Analysis
#NOT Buy incrementally from this support block with a short term target of at least 15%+ from here.
Notcoin short back to $0.002642Just now opened a short position on notcoin. Aiming for $0.002642. Expecting the move to playout tonight leading into US session.
Roughly 2RR+
Stop: $0.002862 or higher

Notcoin Inverted Head & Shoulders (PP: 250% Easy)This is a different view of the chart. The iH&S (inverted head and shoulders) pattern is a reversal pattern. The breakout above the neckline and retest as support fully confirms the bullish bias.
Notcoin is bullish confirmed. The bottom is in based on this pattern and the retrace after the initial bullish breakout with support holding. This means that a major advance is to happen next.
The target I am showing on this one is the main target, "back to baseline," but this is not the end. This would be the minimum on the first impulse up. This target should reach fast and it is very strong because it would yield from current price a nice ~250% profits. More down the road.
This is a pair that you cannot miss, or you can.
This is a pair that looks good and is sure to grow incredibly strong in this 2025 bull market, that is why I continue to share it everyday.
There are many options of course, many great Altcoins, but some are just certain to grow strong. I am showing you some of everything, the ones that are certain I post more often. You can do great in this bullish cycle, I know.
You can do this and thanks a lot for the support and follow.
I will shower you with hundreds of unique charts and great content, great profits if you decide to follow trade/buy and hold. Buy now when prices are low. Sell later when we hit resistance on the way up. It is very easy. Easy if you trust. Trust the Master of the charts.
Namaste.

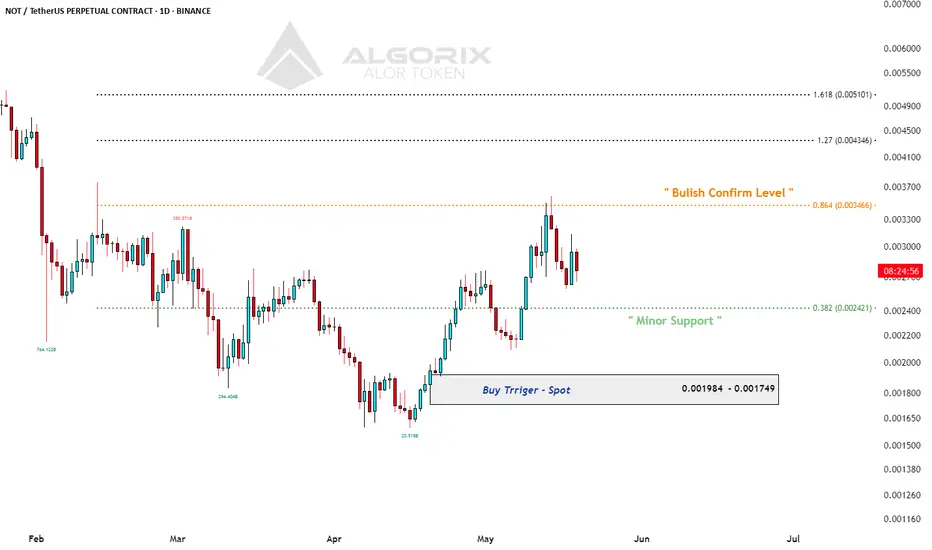
#NOTUSDT #ALOR #ALORPROP #ALORUSDT #ALGORIXOn the daily timeframe, NOT Coin is currently trading just below a key resistance level, which — according to this analytical approach — we refer to as the Bullish Confirm Level. A break above this level could potentially trigger a move toward the next Fibonacci target.
On the other hand, if a price correction occurs, the minor support level could offer a potential (but high-risk) entry point.
A lower-risk zone for spot buying and long-term investing would be around the gray box area, which marks a more significant support region.
📌 This analysis does not constitute financial advice.
ENA/USDT – Weekly Chart Analysis
✅ Rounded Bottom Pattern Formation
ENA appears to be forming a rounded bottom, a classic accumulation and reversal pattern. Price has bounced from a strong demand zone near $0.25, where historically bulls have shown aggressive entry.
🔍 Technical Breakdown:
Accumulation Zone (Support): $0.2515 – acting as the long-term base.
Current Price: ~$0.3788
Pattern Type: Rounded Bottom with higher low structure.
Bias: Bullish continuation if weekly candle closes above current consolidation.
🎯 Target Projections:
Target 1: $0.8050 – Psychological & technical resistance
Target 2: $1.0849 – Mid-range supply
Target 3: $1.3595 – Measured move completion of the pattern
📈 Bullish Confirmation:
Breakout from the right shoulder above $0.40–$0.45 zone would confirm upward momentum.
Watch for volume confirmation and strong closes above weekly highs.
⚠️ Invalidation Level:
Drop below $0.2515 would invalidate the pattern and signal continuation of the downtrend.
📝 Summary:
ENA is showing a technically clean bottoming structure. If buyers step in with volume, the chart supports a potential +200% upside from current levels. Ideal zone for long positioning was highlighted at the base, with a healthy risk-to-reward structure.

NOT/USDT – Weekly Chart Analysis
✅ Bullish Falling Wedge Breakout
The chart shows a clean breakout from a falling wedge pattern, a bullish reversal structure. This marks the end of the long-term downtrend and potentially the start of a new uptrend.
🔍 Key Technical Insights:
Breakout Level: $0.0027–$0.0029 range
Support: $0.00166 (base of wedge & critical invalidation zone)
Pattern Type: Falling wedge with narrowing volatility and bullish breakout
🎯 Price Targets:
Target 1: $0.005699 (first major resistance zone)
Target 2: $0.009607 (measured move of the wedge and previous horizontal resistance)
📈 Technical Outlook:
Breakout is supported by higher lows post-pattern.
Weekly structure now shifts to bullish bias.
Pullbacks toward the breakout area may offer buying opportunities.
⚠️ Invalidation Level:
Drop below $0.00166 would invalidate the bullish setup and reintroduce downside risk.
🔎 Summary:
The setup suggests early-stage bullish momentum. If volume increases and market sentiment supports altcoins, NOT/USDT could aim for over +200% upside from current levels.

Notcoin Will Continue RisingNotice where the action is happening on the chart, right above "short-term support" which was previously our "final resistance." As long as Notcoin trades above this level we are supper bullish, but there is more.
The higher low from 7-8 May is also a strong support. Notcoin can drop to these prices without breaking the bullish structure. If there is a drop, which is low probability, this would be a buy opportunity.
Those who managed to buy early/low when I shared the first few charts and signals should continue to hold easily, the market never moves straight up nor straight down, it creates waves. When these waves are happening, we get a few days green followed by a few days red. But this happens with higher highs and higher lows. Since it is a long-term bullish wave, since it is a long-term bullish cycle, growth doesn't happen in a single day, it takes time, but it grows and keeps on growing. Slowly but surely...
For example, since 16-April NOTUSDT managed to grow a total of 125%. This is great growth, but even as the market is bullish and moving higher, there were still many red days. These red days are normal, part of the bullish wave. It is the same now, the market will continue rising, with small pauses every now and then.
If there is a retrace, buy more. As soon as support is hit or after just a few days are gone, you will experience a clear and sure bullish continuation. When the market moves straight up is only at the end, in the fifth wave and bull run phase. Right now things are only getting started, so we see growth happening step by step.
Patience is key.
Thank you for reading.
Namaste.

NOTCOIN : IT'S TIME TO BUY GUYSHello dears
If you are risk-averse, this analysis is for you...
According to the bullish pattern that has formed, you can see that we had a decline and now it is time to take a logical risk, that is, we buy at the specified levels with capital management to move towards the specified goals...
*Trade safely with us*

What's going next?Tell me your opinions.
////
Notcoin is a meme coin built on the TON blockchain, initially launched as a tap-to-earn game on Telegram.
It quickly went viral, attracting millions of users before transitioning into a real crypto token via an airdrop.
Notcoin is part of the growing The Open Network (TON) ecosystem, which is tightly integrated with Telegram.
Its goal is to onboard users into Web3 through gamification and social interaction.
The token, symbolized as NOT, is now listed on major exchanges like Binance.
Not usdt#long
Time frame:Daily &H4
This currency has the ability to grow by at least 30% in the short term according to technical patterns.

#NOT/USDT#NOT
The price is moving within a descending channel on the 1-hour frame, adhering well to it, and is on its way to breaking it strongly upwards and retesting it.
We are seeing a bounce from the lower boundary of the descending channel, this support at 0.002681.
We have a downtrend on the RSI indicator that is about to break and retest, supporting the upward trend.
We are looking for stability above the 100 moving average.
Entry price: 0.002940
First target: 0.003096
Second target: 0.003209
Third target: 0.003428

#NOT/USDT#NOT
The price is moving within a descending channel on the 1-hour frame, adhering well to it, and is heading for a strong breakout and retest.
We are seeing a bounce from the lower boundary of the descending channel, which is support at 0.002465.
We have a downtrend on the RSI indicator that is about to be broken and retested, supporting the upward trend.
We are looking for stability above the 100 moving average.
Entry price: 0.002621
First target: 0.002700
Second target: 0.002777
Third target: 0.002856

NOTCOIN: Bullish H&S#Notcoin had major hype after its mid-2024 launch but that was followed by a steep drop with over 90% from its ATH.
#NOT's recent bounce formed a bullish H&S pattern that confirms with passing $0.00323. The idea is invalidated if it drops below $0.002, the stop-loss level.
