New Bullish Trend About To Start 📈 There Is a Bull Flag Formed At The Chart By The Clear ABC Structure And The Price Bounced From The PRZ Well, Expect a New Bullish Rally By Breakout The Trend Line Toward a 0.012 And 0.014$ Soon
NOTUSDT trade ideas

$NOT D1 Chart Idea🪙 GETTEX:NOT D1 Chart Idea
💁 Notcoin is a community-driven cryptocurrency that originated as a viral Telegram game, integrating users into the web3 space with a tap-to-earn mining mechanic. Recenty,16M tokens were burnt to create a positive market sentiment. However, Not coin has underperformed, dropping by almost 4% within 7 days.
🎩 Notcoin's price currently is on a downtrend and might follow this bullish triangle's price action. $0.0089 to $0.0077 should be a reasonable price for accumulating. . Still, caution should be taken care when trading against BTC.
May the trading Gods be with you. 🧎

Market Pushes Towards $0.01152 with Bullish Momentum#NOTUSDT Analysis:
The NOTUSDT pair is showing strong bullish momentum as the price steadily climbs towards the $0.01152 region. This move is supported by a clear buy bias, particularly evident with the formation of the Luftwing Candle on the 4-hour (4H) chart.
Key Technical Analysis:
Critical Price Levels:
Target at $0.01152: The $0.01152 level is emerging as a crucial target, acting as the next resistance level that bulls are eyeing. A successful breach of this level could pave the way for further gains, possibly towards $0.01170 or even $0.01200 in the near term.
Support Zone: The immediate support is found at $0.01120, which has provided a solid base for the current upward movement. If the market faces any pullback, this level is likely to act as a strong support.
Luftwing Candle Formation on 4H Chart:
The 4-hour chart is showing the formation of a Luftwing Candle, which is a strong bullish signal. This candlestick pattern is characterized by a long lower wick and a smaller body, indicating that buyers have successfully absorbed the selling pressure and are pushing the price higher.
The appearance of the Luftwing Candle, especially in the context of an uptrend, confirms the buy bias and suggests that the bulls are likely to maintain control in the coming sessions.
Momentum Indicators:
MACD (Moving Average Convergence Divergence): The MACD is showing a bullish crossover, with the MACD line crossing above the signal line, further confirming the upward momentum.
RSI (Relative Strength Index): The RSI is trending upwards but remains below overbought levels, indicating that there is still room for the price to move higher without immediate risk of a reversal.
Market Structure and Trend Analysis:
The overall market structure remains bullish, with higher highs and higher lows being established on the 4H chart. This trend continuation pattern supports the likelihood of reaching and potentially surpassing the $0.01152 resistance level.
Potential Scenarios:
Bullish Continuation: If NOTUSDT breaks above $0.01152 with sustained volume, the next targets would be $0.01170 and $0.01200. Traders should watch for confirmation of this break to enter new positions.
Short-term Pullback: In case of a pullback, the $0.01120 support level is expected to hold, providing a potential buying opportunity for traders looking to capitalize on the continued upward momentum.
Conclusion:
NOTUSDT is currently in a strong uptrend, with the $0.01152 level in sight. The formation of the Luftwing Candle on the 4H chart reinforces the buy bias, suggesting that the bulls are in control and pushing the market higher. Traders should monitor the price action around the $0.01152 resistance level for potential breakout opportunities or look for support at $0.01120 in case of any retracement.
Stay vigilant and manage your trades carefully as the market dynamics unfold.

Breaking Support and Returning to Lower LevelsThe NOT price, after moving to the $0.0090 support level and collecting stop-losses in this area, has moved higher and is currently near a potential resistance zone. This area could be crucial for determining whether the upward trend will continue or if the price will return to lower levels.
Potential Scenarios:
Continuation of the Upward Trend:
If the price can stabilize above the $0.0090 level, it may move towards higher targets. This support level could act as a point for attracting new buyers and continuing the upward trend.
Breaking Support and Returning to Lower Levels:
If the price fails to stabilize above this level and returns below it, a correction to lower levels may occur, potentially forming a new low.


Notcoin .... Support and resistance Hello my dear friends...
I present my analysis in this chart which is in 30 minutes time frame in Natcoin.
This analysis is based on time analysis at this time and is based on showing support and resistance points .
with the limit of loss in the support lines, at the top of the chart. Be successful and profitable.

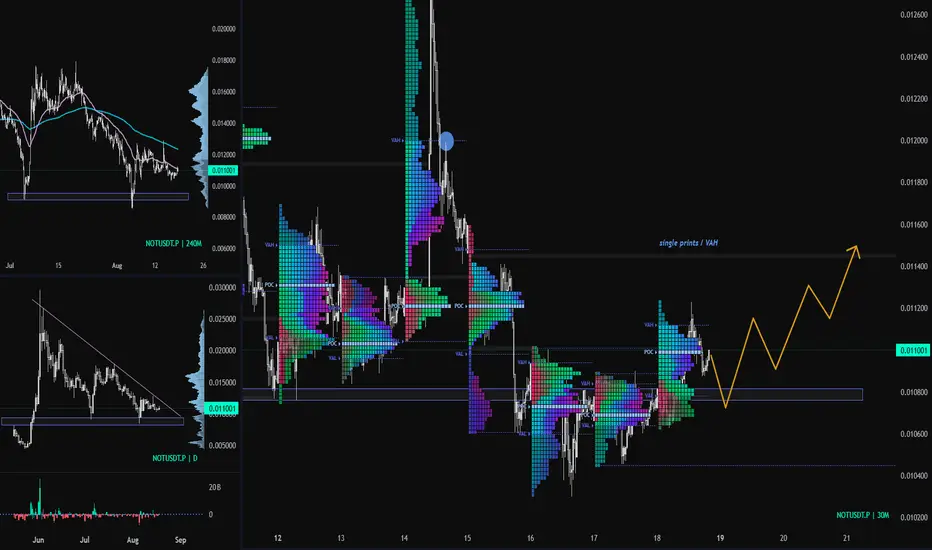
$NOT breakout soon?NOTCOIN bounced off the demand zone and it's currently trading within a wedge/triangle on the daily chart. Preparing for a potential breakout?
What I'm looking for:
> Hold 0.0105 support level
> Clean break and close above the pivot point 0.0112
If we can break 0.0112 resistance , 0.0115 would be the ideal initial target (single prints/ VAH)
Next target 0.012 area (trapped longs)
NOTUSDT.4HThe chart for NOT/USDT on a 4-hour timeframe provides a comprehensive view of the market movements of the NOT token against USDT. Let's delve into the analysis based on the information from the chart:
Current Situation
Price Level: NOT is currently trading at $0.0180.
Recent Price Action: The price has been in a downtrend and is now showing signs of consolidation with potential early signs of stabilization or reversal.
Support and Resistance Levels
Resistance Levels (R1, R2, R3):
R1: $0.01046
R2: $0.01285
R3: $0.01411
Support Levels (S1 and S2):
S1: $0.00855
S2: Slightly below $0.00855, possibly around $0.00800.
Technical Indicators
MACD: The MACD line is slightly below the signal line, indicating a bearish momentum. However, the histogram bars are close to the baseline, suggesting a decrease in downward momentum.
RSI: The Relative Strength Index is at 46, which is neither in the overbought nor oversold territory. This could indicate that there is potential for movement in either direction without immediate pressure from market extremes.
Analysis and Conclusion
From my perspective, NOT is at a critical juncture. The consolidation pattern near a support level suggests that sellers are losing steam and a reversal could be imminent. However, the resistance levels above current prices will be key hurdles to watch.
Trading Strategy
Bullish Scenario: If NOT can break above the resistance at $0.01046 with significant volume, it could signal a shift in momentum, potentially targeting higher resistances at $0.01285 and then $0.01411.
Bearish Scenario: If NOT breaks below the support at $0.00855, it could lead to further declines, with the next possible support around the $0.00800 mark.
Final Thoughts
Given the current market conditions and technical setup, it's crucial to closely monitor NOT’s interaction with its key support and resistance levels. Placing stop-loss orders below the major support level can be a prudent measure to manage risks. Always ensure that trading decisions align with broader market conditions and individual risk tolerance.

not buy/long setupThe major structure of NOTCOIN is bearish, but this coin is approaching a fresh orderblock.
We expect the price to be rejected upwards from this demand.
Closing a daily candle below the invalidation level will violate the analysis.
Note that the financial market is risky, so:
Do not enter a position without setting a stop and capital management and confirmation and trigger.
When we reach the first TP, save some profit and try to move the stop continuously in the direction of your profit.
If you have any comments please post them, comments will help us improve our performance
Thanks

not time buy?If you want to take more risk, 60% of the capital should be bought in the first target, and if it falls, 40% should be bought in the Don area.
And those who are not risk takers can start buying when the conditions are completely bullish
In any case, the market is volatile and capital management is your savior

(Update) !!! Daily Chart Analysis (READ)BINANCE:NOTUSDT
The reasons I mentioned in the analysis before, the price increased after the wedge broke, and after the price correction wave, can reach the next targets.
✨Traders, if you liked this idea or have your opinion on it, write in the comments, We will be glad.
_ _ _ _ __ _ _ _ _ _ _ _ _ _ _ _ _ _ _ _ _ _ _ _ _ _ _ _ _ _ _ _
✅Thank you, and for more ideas, hit ❤️Like❤️ and 🌟Follow🌟!
⚠️Things can change...
The markets are always changing and even with all these signals, the market changes tend to be strong and fast!!

NOT sell/hot setupThe big NOTCOIN structure is bearish.
Looks like it's creating an internal pullback now. The liquidity pool has also swept the top of the chart.
By reaching the swap range, you can enter the sell/short position.
Closing a 4-hour candle above the invalidation level will violate the analysis
Note that the financial market is risky, so:
Do not enter a position without setting a stop and capital management and confirmation and trigger.
When we reach the first TP, save some profit and try to move the stop continuously in the direction of your profit.
If you have any comments please post them, comments will help us improve our performance
Thanks

Notcoin (NOT): Sellers Are Showing DominanceSince our last look at Notcoin, we have been seeing a lot of pressure from sellers, where prices have been declining slowly and trading nicely below EMAs.
We are still looking for that support zone to be touched so we are waiting and keeping an eye on that zone!
Swallow Team

NOTCoin → Pullback after a false breakdown. When is it going up?BINANCE:NOTUSDT on the background of the rally ( together with TON ) strengthens and updates the maximum 0.0129, thus forming a retest of the wedge resistance. The attempt is unsuccessful, the reaction is a pullback to the liquidity zone.
Fundamentally interesting project in the medium and long term can still show good growth, but for this developers need to try. The prospects of Notcoin will depend on the innovations developed by the project, its marketing strategy and the state of the overall cryptocurrency market.
Technically, a false breakdown of the wedge resistance is forming amid bitcoin's decline. The price may test the liquidity area of 0.0105 and then a retest of the resistance may follow. I do not exclude the fact that the support may be broken without any corresponding reaction, in this case we will wait for a retest of trend support.
Resistance levels: 0.1294
Support levels: 0.01053, 0.00912
Accordingly, any breakout and consolidation of the price above the wedge resistance will be a strong signal for further rally. As long as the price has not left the range, it is worth considering trading inside this pattern.
Rate, share your opinion and questions, let's discuss what's going on with ★ BINANCE:NOTUSDT ;)
Regards R. Linda!

NOT/USDT Technical Analysis in 12-Hour TimeframeHello everyone, I’m Cryptorphic.
For the past seven years, I’ve been sharing insightful charts and analysis.
Follow me for:
~ Unbiased analyses on trending altcoins.
~ Identifying altcoins with 10x-50x potential.
~ Futures trade setups.
~ Daily updates on Bitcoin and Ethereum.
~ High time frame (HTF) market bottom and top calls.
~ Short-term market movements.
~ Charts supported by critical fundamentals.
Now, let’s dive into this chart analysis:
NOT is under a symmetrical triangle pattern, facing resistance at the 21 EMA at $0.01160. If the price gets rejected from this resistance, it is likely to reach the green box between $0.00988 and $0.01056.
The crucial resistance for NOT is at $0.013, and once it breaks above this resistance trendline, a bullish rally is possible. The support trendline between $0.00988 and $0.01056 must hold the price.
Key levels:
- Support/Accumulation: $0.00988-$0.01056
- Resistance: $0.01160 (EMA) and $0.013 (Resistance trendline)
- Target: $0.03
We will re-analyze the chart if the price closes below the support trendline.
DYOR, NFA.
Please hit the like button to support my content and share your thoughts in the comment section. Feel free to request any chart analysis you’d like to see!
Thank you!
#PEACE

Notcoin(NOT) Analysis==>>TriangleNotcoin(NOT) is moving in the Heavy Resistance zone($0.0158_$0.0153) and broke the symmetric triangle's upper line and 100_SMA(4-hour TF) ( with significant volume ).
According to the theory of Elliott waves , it seems that we should wait for the next 5 impulse waves of Notcoin(NOT) .
I expect Notcoin(NOT) to rise again, at least until the Monthly Pivot Point . If the Heavy Resistance zone($0.0158_$0.0153) is broken, we can wait for the Notcoin(NOT) pump .
Notcoin(NOT) Analyze (NOTUSDT), 1-hour time frame ⏰.
Do not forget to put Stop loss for your positions (For every position you want to open).
Please follow your strategy; this is just my Idea, and I will gladly see your ideas in this post.
Please do not forget the ✅' like '✅ button 🙏😊 & Share it with your friends; thanks, and Trade safe.

Not is exactly where we want #NotCoinThanks alot for your supports ♥
if you were agree Boast it to moon 🚀
Notcoin just has recently broken DownTrend 📉❌
Now we are waiting for a bullish UP Trend 📈🔝🆙
Hold some Notcoin in Notcoin app and after release you would be More happy 😍

NOT BREAKOUT BEARISH TREND LINE Hi dear traders
The price breakout and retest bearish trend line, and now ready to attack to resistance area near 0.014.
If hold 0.012 in daily time frame we expect to reach all targets
Let's see what happens
This is not financial advice ( DYOR )
Good luck 👍


NOTCOIN: DOWN BEFORE A POSSIBLE $0.01160I think it would be best to wait a bit for NOTCOIN to sell in the $0.01091 zone before buying up.
remember that fundamental may change things. always use SL

Notcoin(NOT) Roadmap!!!Notcoin(NOT) is moving in the Heavy Resistance zone($0.0158_$0.0153) and seems to have broken the Support lines .
According to Elliott's wave theory , Notcoin(NOT) is completing the Zigzag Correction .
I expect Notcoin(NOT) to drop to at least $0.01093 and touch the Potential Reversal Zone(PRZ) next.
Notcoin(NOT) Analyze (NOTUSDT), 1-hour time frame ⏰.
Do not forget to put Stop loss for your positions (For every position you want to open).
Please follow your strategy; this is just my Idea, and I will gladly see your ideas in this post.
Please do not forget the ✅' like '✅ button 🙏😊 & Share it with your friends; thanks, and Trade safe.

Can NOTCOIN Reach $0.01545? I am BullishA Midterm Bullish Analysis
Current Price: $0.01217
Target Price: $0.01545
Midterm Perspective: Bullish
As of the current price of $0.01217, NOTCOIN is in a consolidation phase after experiencing significant volatility. The broader cryptocurrency market has shown signs of recovery after a bearish period, with several altcoins gaining traction.
The market sentiment appears cautiously optimistic, especially for meme coins like NOTCOIN, which have strong community support.
Conclusion
NOTCOIN has the potential to reach $0.01545 from its current price of $0.01217, given favourable market conditions
